See what your analytics, marketing tags and consent setup are actually doing
TagPipes Companion turns analytics events, tags, consent signals and cookies into plain English inside Chrome DevTools. Free, no account, and everything stays in your browser.
- Free
- No account
- Inspects the page in your browser
- Findings you can act on, not a compliance verdict
Who it's for
People who own the numbers but shouldn't need a developer to check them.
Marketers
Check that the conversion you just launched fires, once, with a value and a currency, on every platform it should reach. Open the page, open Companion, read the answer.
Digital analysts
See every analytics and marketing event with the tool that sent it and the property or pixel it went to. Catch the duplicate purchase or the second Google Analytics 4 property before it reaches a report.
Implementation teams
QA a release or a client site: which vendors load, what they send, and what happened before the visitor made a consent choice. The raw requests stay one tab away for when you need them.
What Companion finds
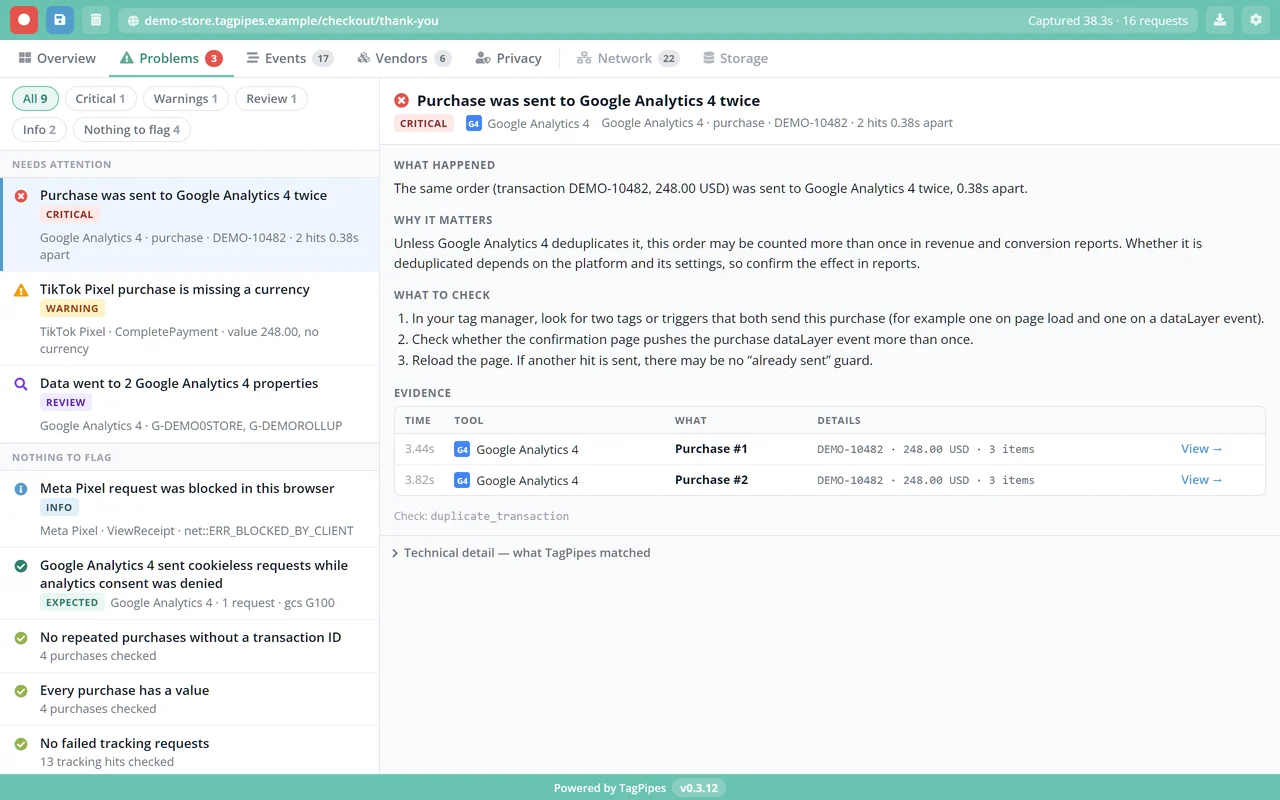
Each finding says what happened, why it matters, what to check, and the evidence behind it. Levels run from Critical and Warning through Review and Info to Expected, and checks that passed say "Nothing to flag".
Duplicate purchases
The same order sent to the same platform more than once, with the transaction ID and how far apart the hits were.
Missing event values
A purchase or conversion sent without a value or a currency, so it can't be counted as revenue properly.
Tags sent before a consent choice
After a page load capture, which vendors sent requests, and which cookies and storage were written, before the visitor chose.
Also checks for
More than one analytics property. Data from one page going to two Google Analytics 4 properties, which is sometimes intended and sometimes a leftover.
Failed or blocked tracking requests. Tracking hits that returned an error, or were blocked in this browser, labeled so you can tell a real failure from an ad blocker.
Expected behavior, labeled as Expected. Not every technical condition is an error. Cookieless Google requests sent while consent is denied, for example, are marked Expected, not flagged.
Findings are observations of what this browser saw on this page load. They're a starting point for checking your setup, not a verdict on it.
A tour of the panel
Three views answer most questions. Three more hold the detail, and Network is there for when you need to go deeper.
View 1
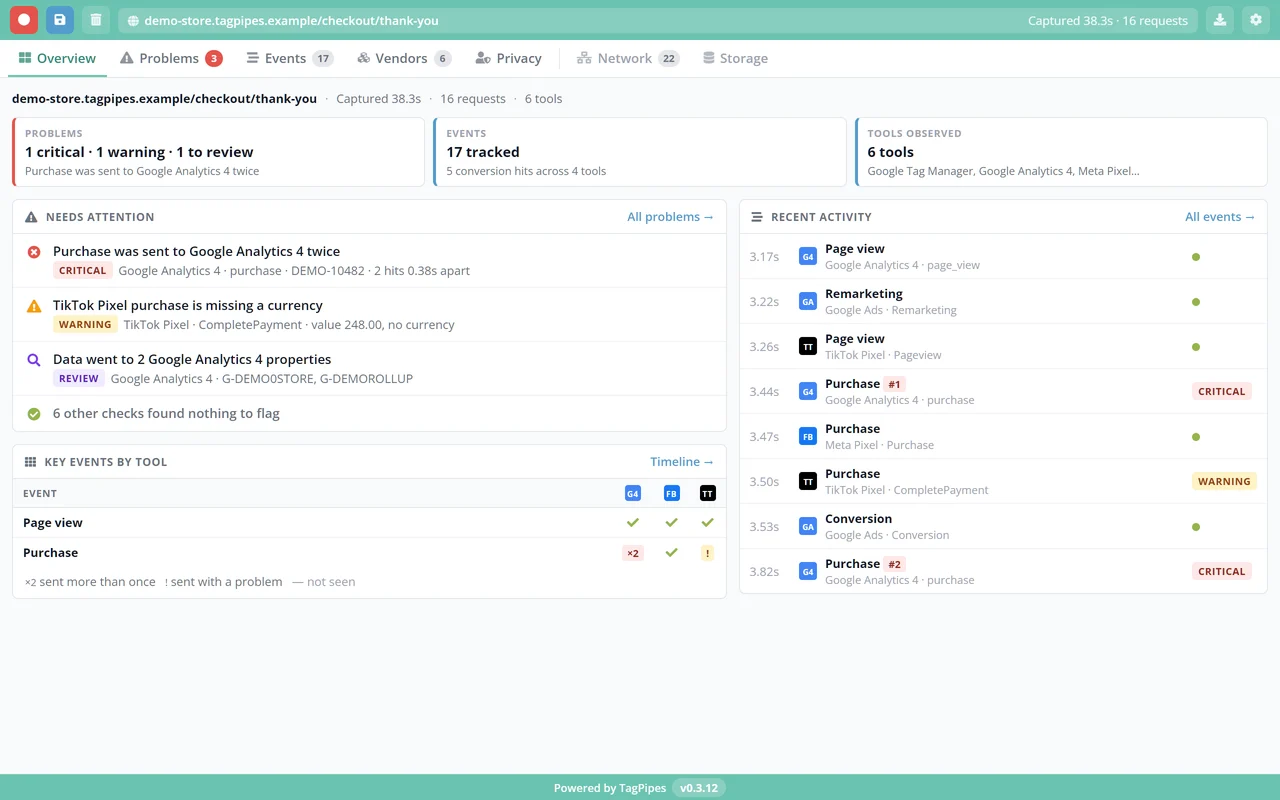
Overview
The page at a glance: what needs attention, how many events were tracked, which tools were seen, and the latest activity in order.
View 2
Problems
Every finding with its level, grouped into what needs attention and what had nothing to flag, each with the steps to check it.
View 3
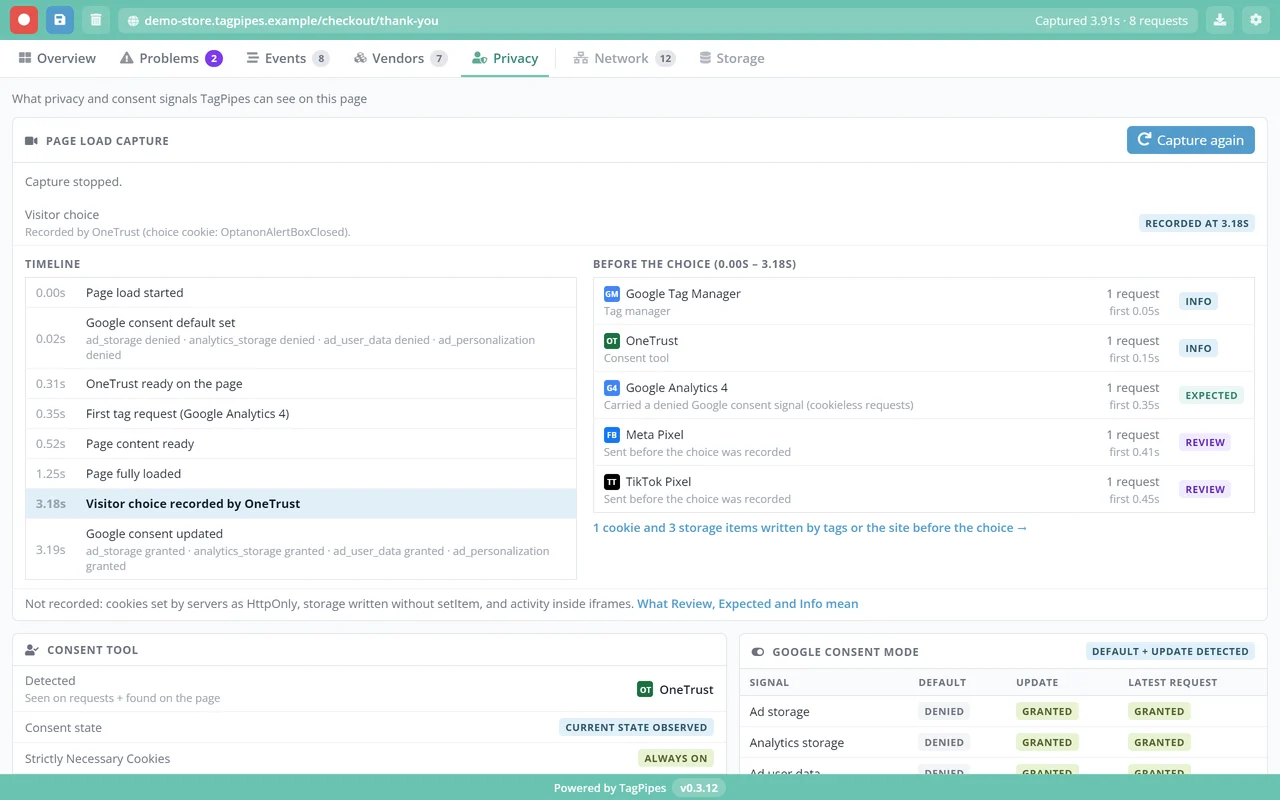
Privacy
The consent tool, Google Consent Mode, and privacy signals. After a page load capture, a timeline of the consent default, the tags, the visitor's choice and what came before it.
More views in the panel
Events
Every analytics and marketing event with a readable name first and the vendor's own name second, plus the IDs, values and consent details it carried.
Vendors
The marketing and analytics tools detected on the page. Open one to see its events, its requests and any problems that belong to it.
Storage
Cookies, localStorage and sessionStorage written during a captured load: who set each one where that's recognizable, when, and whether it was before or after the choice. Values are never shown.
For the technical view
Network
The deeper technical view: every recognized tag request and its parameters, decoded. You won't need it for most questions, and from an event you can jump straight to the matching request.
Check Google Consent Mode and what happens around consent
A consent banner can look right and still behave in ways nobody intended. Companion shows the signals your consent setup actually sends, and what the tags did around the visitor's choice.
Google Consent Mode
The default and the update for each signal (ad storage, analytics storage, ad user data, ad personalization) and what the latest Google request actually carried.
Your consent tool
Supported consent platforms including OneTrust, Cookiebot, TrustArc, CookieYes, Termly and TagPipes Shield, and the state Companion can observe on the page.
Privacy signals
Global Privacy Control, Do Not Track, TCF, GPP and US Privacy signals, when they're observable on the page.
Before and after the choice
With a page load capture: when the visitor's choice was recorded, which vendors sent requests before it, and which cookies and storage items were written before it.
Google's consent state is not the same as permission for every vendor
Google Consent Mode tells Google's own tags what they may do. A Meta or TikTok pixel doesn't read it on its own; whether those wait for a choice depends on how your consent tool and tag manager are set up. So Companion lists non-Google requests seen before the choice separately and marks them Review rather than calling them errors. Whether each one should have waited is a decision for your team, not something a browser extension can settle.
Reload and capture, in three steps
Some things only happen in the first second of a page load. A page load capture records them from the start.
1. Open the TagPipes panel
On the page you want to check, open Chrome DevTools (F12, or Ctrl+Shift+I on Windows, Cmd+Option+I on a Mac) and choose the TagPipes tab. To see a first visit, use a private window or clear the site's data first.
2. Click Reload and capture
It's on the Privacy and Storage views. The page reloads with Companion watching from the first moment: the consent default, the tags, cookies and storage.
3. Choose, then read the timeline
Accept or reject in the banner as a visitor would. Companion records when the choice happened and shows what fired and what was written before and after it.
Your data stays in your browser
Companion does its inspection locally in Chrome. What it captures from the pages you look at isn't sent to TagPipes, and you don't need an account to use it.
- Only while you're looking. Companion lives in Chrome DevTools and inspects the page you have DevTools open on.
- Captured activity stays local. Events, requests, consent signals, cookies and storage are read and explained in your browser, not uploaded.
- Values stay hidden. The Storage view shows cookie and storage names, who set them and when. It never shows their values.
- Exports are yours to make. Nothing leaves the panel unless you export or copy it yourself.
- One permission. Companion asks Chrome for storage, which it uses for your own settings.
Install it and open it
- 1
Add it to Chrome
Install TagPipes Companion from the Chrome Web Store. It's free and there's nothing to sign up for.
- 2
Open any page
Any page you can open in Chrome: your own site, a staging build, or a client's live site.
- 3
Open DevTools and find the TagPipes tab
Press F12 (or Ctrl+Shift+I, or Cmd+Option+I on a Mac). If the tab isn't visible, it's behind the >> menu at the end of the DevTools tab row.
- 4
Start with Overview
Then open Problems for anything flagged, or Privacy to capture a page load.
Look up what you found
Seen a cookie, a vendor or a request you don't recognize? The TagPipes reference pages explain what it is, who sets it and what the vendor documents about it.
Frequently asked questions
See what your tags are really doing.
Free, no account, and it runs in your browser. Open it on the next page you're not sure about.
Add to Chrome, it's freeTagPipes monitors, configures and reports. It does not determine legal compliance and does not provide legal advice. Output is informational and reflects observed state at the time of observation. Rawsoft's expertise is technology, not law; please confirm any regulatory interpretation with your own counsel.