What you will build
By the end of this page you will have one synced data table, a board with three tiles on it, and a report link you can send to anyone. You need a TagPipes property and access to one data source, for example a Google Analytics 4 property connected under Security & Access.
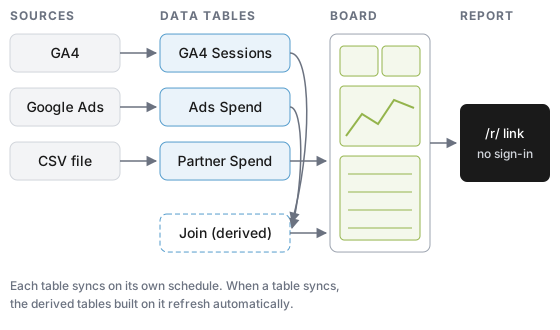
Step 1: Create your first table
Open Lens. On a new property you see Welcome to Lens.
If your data comes from GA4, Adobe Analytics, Google Ads, Meta Ads, Olo or Echo, use a recommended setup. It creates the right set of tables for that source in one step and reuses tables you already have:
- Go to Configure > Data Tables and click Recommended Setups.
- Pick the card for your source.
- Fill in the inputs it asks for, such as the service connection and the GA4 property.
- Click Review and Apply, check the list, then click Apply and Start First Sync.
For a CSV file, BigQuery, a REST API or any other source, click + New Table on Data Tables instead and follow Create a Data Table.
Start with a backfill of the last 30 days. You can extend the history later, and a short first sync means you see data in minutes rather than hours.
Step 2: Wait for the first sync
Open the table. Its status moves from queued to syncing to active. Once it reads active, the rows are ready for boards. If it shows error, the table page tells you why; Sync Data covers the common causes.
Step 3: Build a board
- Go to Boards and click + New Board. Give it a name.
- Click + Add Tile. Choose the KPI type, your new table, and a metric such as
sessions. Click Add Tile. - Add a Line tile with the same metric. Leave Group By empty so you get one line over time.
- Add a Table tile with the metric and Group By set to a dimension such as
sessionDefaultChannelGroup. - Click Create Board.
The board opens with the default date range, the last 30 days. Use the date picker at the top to change it; every tile follows the board's dates unless you gave it its own range.
Step 4: Share it as a report
- Go to Reports and click + New Report.
- Name it, tick your board, and optionally set a password.
- Click Save Report.
Copy the link from the Reports list. Anyone with the link can open the report without signing in. Each board in a report becomes a tab.
Check it worked
Open the report link in a private browser window. You should see the same three tiles with the same numbers as the board. If the report asks for a password, enter the one you set; the browser remembers it for 30 days.
Where to go next
- Add more sources: Google Ads, BigQuery, CSV files.
- Combine tables: Join, Union, Pivot.
- Understand the model: How Lens Works.