What it shows
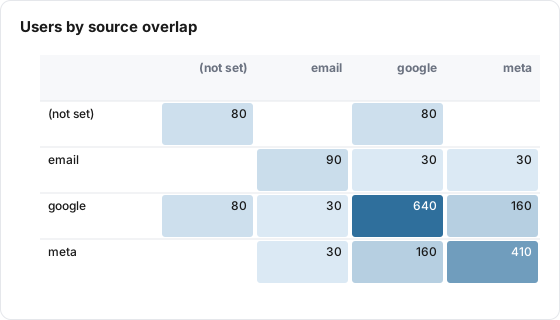
The Overlap tile is a square heatmap. Each row and each column is one value of a dimension you pick, such as a traffic source. A cell shows how many distinct users had rows with both values in the date range. The diagonal cells show the total users for each value.
| Use it for | Not for |
|---|---|
| Seeing how much two channels share the same people | Counting sessions or events (it counts users only) |
| Spotting channels whose users rarely appear anywhere else | Showing the order people saw channels in (use Journey) |
| Checking how many QR or email users also arrive from search | Crediting conversions to channels (use Attribution) |
Example
An events table has one row per event, with these columns:
| Column | Example values |
|---|---|
client_id (user key) | 1001.17, 1002.44 |
utm_source | google, meta, email, empty |
event_name | page_view, purchase |
| Setting | Value |
|---|---|
| Type | Overlap |
| Data Table | Web events |
| User Key | client_id |
| Overlap Dimension | utm_source |
| Cohort (optional) | All users (no cohort) |
Over the board's date range, Lens groups users by the set of sources they came from:
| Sources a user came from | Users |
|---|---|
| 400 | |
| meta | 250 |
| google, meta | 130 |
| (not set), google | 80 |
| 60 | |
| email, google, meta | 30 |
The tile then draws this matrix. Rows and columns are sorted alphabetically.
| (not set) | meta | |||
|---|---|---|---|---|
| (not set) | 80 | 80 | ||
| 90 | 30 | 30 | ||
| 80 | 30 | 640 | 160 | |
| meta | 30 | 160 | 410 |
The google and meta cell is 160: the 130 users who came from both, plus the 30 who came from email, google and meta. Hovering over it on the board shows "160 users overlap" and "39% of meta users (410)", because meta is the smaller of the two. Empty cells are zero and show no number.
Data it needs
- A user key: a dimension that identifies one person across rows, such as a client ID or user ID.
- The overlap dimension: the dimension whose values you want to compare, such as
utm_sourceor a channel column. - Several rows per user. A table with one row per user can only ever put each user in one cell of the diagonal.
Rows where the overlap dimension is empty are counted under (not set).
Settings
| Setting | What it does | Default |
|---|---|---|
| Title | The tile header. Required | Empty |
| Description | Optional text behind an info icon on the tile, up to 500 characters | Empty |
| Type | Overlap | KPI |
| Size | Small (1/4 width), Third, Medium (1/2) or Large (full width) | Medium |
| Data Table | The table to read | None |
| User Key | The dimension that identifies a user. Required | None |
| Overlap Dimension | The dimension whose values form the rows and columns. Required | None |
| Cohort (optional) | Limits the tile to users in one cohort. Only cohorts built on the same table are listed | All users (no cohort) |
| Date range | Shown in the editor, but this tile always follows the board's date range (see Limits and gotchas) | Inherit from board |
The Overlap tile has no metric, Group By, tile filters or join.
How it calculates
- Lens reads every row of the table whose date falls in the board's date range. With a cohort, only rows of users in the cohort are read.
- For each user key, it collects the distinct values of the overlap dimension the user had. Empty values become (not set).
- It counts users per combination of values and keeps the 50 most common combinations.
- The tile builds the matrix from those combinations. A cell for values A and B adds up every combination that contains both. A diagonal cell adds up every combination that contains that value, so it is the number of users who had that value at all.
Each user is counted once per cell, however many rows they have. The board's hover text gives the overlap as a share of the smaller of the two values' totals.
If no rows match, the board shows "No overlap data found" and the public report shows "No data available".
What viewers can do
| Action | Board | Public report |
|---|---|---|
| Hover a diagonal cell | Value name and total users | Value names and the count |
| Hover any other cell | Users who overlap, and the share of the smaller value's users | Value names and the count |
| Info icon | Shows the tile description, when one is set | Same |
| "How to read this" icon | Opens a short guide to the tile | Not shown |
| AI button | Summarizes the tile, when AI features are on for the property | Not shown |
| Change the date range | The tile reloads for the new range | Same |
Nothing on the tile is clickable, and there is no export.
Limits and gotchas
- Only the 50 most common combinations are used. Users whose combination of values is rarer are left out of every cell, including the diagonal. With many distinct values, diagonal totals can come out lower than a plain count of users per value.
- Board filter chips do not apply. The tile ignores the board's filter chips. Use a cohort to narrow it.
- The tile's own Date range setting is ignored. The editor offers one, but the tile always uses the board's date range, on the board and in the public report.
- Dates are the table's stored dates. The range is matched against the date each row is stored under. For sources stored in UTC, such as Echo, that is the UTC date, so a few late-evening events can fall on the neighboring day compared with a Line or KPI tile. See Dates and Time Zones.
- Rows with an empty user key count as one user. Every row with no user key value is grouped together. Filter those rows out at the source or pick a user key that is always filled.
- Errors look like no data on the board. If the query fails, the board shows "No overlap data found" rather than the error.
- Pick a dimension with a handful of values. Every value in the top 50 combinations becomes a row and a column, so a high-cardinality dimension such as a page path gives an unreadable grid.