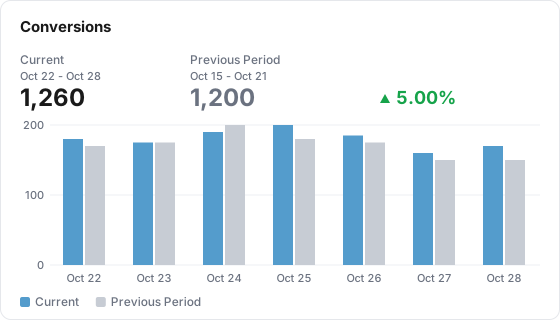
A Comparison tile puts one metric's current total next to an earlier period's total, with the change, and a day-by-day chart of both periods and their variance.
Illustration with the numbers from the Example below
What it shows
A Comparison tile answers "how does this period compare with the one before?" for one metric. A header strip shows the current total, the earlier period's total and the change. Below it, a chart pairs the two periods day by day: current bars, earlier bars in grey, and a variance line on a second % axis.
Use it for
Not for
Week over week or month over month for one headline metric
A breakdown by channel or campaign (use a Table tile with Compare To)
Your table has a date column and a conversions metric. The board is set to the last 7 days, Oct 22 to Oct 28.
Setting
Value
Type
Comparison
Data Table
web_sessions
Metric
conversions
Compare To
Previous Period
Date range
Inherit from board (default)
The header reads "Current" with the dates Oct 22 - Oct 28 and 1,260, then "Previous Period" with Oct 15 - Oct 21 and 1,200, then an up arrow with 5.00%. The chart shows seven pairs of bars:
Day
Current
Previous Period
Variance
Oct 22
180
170
5.88%
Oct 23
175
175
0.00%
Oct 24
190
200
-5.00%
Oct 25
200
180
11.11%
Oct 26
185
175
5.71%
Oct 27
160
150
6.67%
Oct 28
170
150
13.33%
Data it needs
One metric.
A date dimension on the table for the day-by-day chart. Without one, the header totals still work but the chart has nothing to plot.
Nothing else. The tile has no Group By: it always shows one series per period.
Settings
Setting
What it does
Default
Title
Name shown on the tile. Required, up to 80 characters
Empty
Description
Optional text behind an info icon on the tile, up to 500 characters
Empty
Size
Small, Third, Medium or Large
Medium
Data Table
The Lens table the tile reads
None, required
Metric
The metric to compare
None, required
Filters
Limit the tile to matching rows. Applied to both periods. Several filters must all match
None
Date range
Inherit from board (default), Ignore (all available data), Relative range or Fixed dates. Leave it on Inherit, see Limits below
Inherit from board
Compare To
Previous Period, Same Day Last Week, Same Day Last Month, Same Day Last Year, Same Week Last Year (-364d). Required: the tile will not save with None
None, must be set
Abbreviate large numbers
Shows 4.3M, 686K and so on in the header and on the value axis. Hover a header number for the exact value
Off
How it calculates
Periods. The current period is the board's date range. The earlier period depends on Compare To:
Compare To
Earlier period
Previous Period
The same number of days, ending the day before the current range starts
Same Day Last Week
The full calendar week before the week the current range ends in, using the property's week start
Same Day Last Month
The full calendar month before the month the current range ends in
Same Day Last Year
The same dates one year earlier
Same Week Last Year (-364d)
The same dates shifted back 364 days, so weekdays line up
Header totals. Each period's metric total. Ratio and expression metrics are calculated from their summed parts, not averaged.
Change. (current - earlier) / earlier, to two decimal places, with an up or down arrow. It is green or red depending on whether the metric is set as higher-is-better or lower-is-better, and grey for a neutral metric. When the earlier total is 0 the header shows a dash and "No comparison data".
Chart. One bar per day for each period, always daily. Day 1 of the current period sits next to day 1 of the earlier period, day 2 next to day 2, and so on. Every day in each window gets a slot, so a day with no data shows 0. The axis is labeled with the current period's dates. When the two periods have different lengths, the shorter one simply runs out.
Variance line. (current - earlier) / earlier for each day, in %. It is skipped on days where the earlier value is 0, and the line joins across the gap.
What viewers can do
Hover the chart to see both values and the variance for that day.
Click a legend entry (Current, the comparison name, Variance) to hide or show that series.
Hover an abbreviated header number to see the exact value.
Change the board's dates and filter chips. The tile follows them.
Pick a comparison at the top of the board or report (Previous period, Same dates last year, Same weekdays last year, Custom range). It replaces the tile's own Compare To for that view only.
The public report shows the same header and chart.
Limits and gotchas
Keep Date range on Inherit. The totals follow the tile's own range if you set one, but the header dates, the chart's days and the comparison window are worked out from the board's range. The two then disagree.
Same Day Last Week and Same Day Last Month compare whole calendar periods. On a 30-day board, Same Day Last Week compares 30 days of data against 7 days, so the change is meaningless and the earlier bars stop after day 7. Use Previous Period for a like-for-like window.
Unique counts are added up day by day. For a count-distinct metric such as users, the header total sums the daily figures, so a person who came back on three days counts three times.
Long ranges get crowded. The chart is always daily, so a 90-day range draws 180 bars.
No Group By and no additional metrics. One metric, one series per period.