The four building blocks
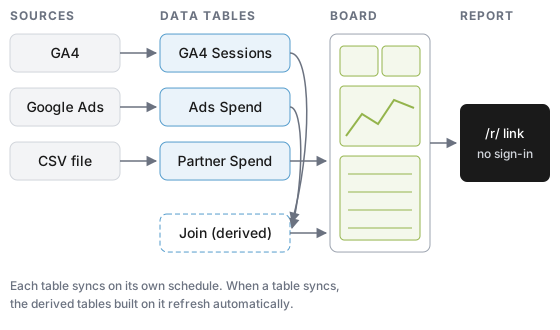
| Block | What it is | You create it under |
|---|---|---|
| Data table | A saved definition of one source: which columns to pull, how far back, and how often. Lens syncs the rows and stores them for fast querying. | Configure > Data Tables |
| Derived table | A table built from other Lens tables: Join, Union, Pivot or Attribution. | Configure > Data Tables, under Composite Tables |
| Board | A page of tiles. Each tile reads one table and shows one or more metrics. | Boards |
| Report | One or more boards shared at a public link, one tab per board. No sign-in needed. | Reports |
Tables and sync
A table starts empty. The first sync loads the backfill window you chose. After that, each scheduled sync re-pulls a short rolling window (7 days for most sources) so late-arriving data is corrected, or rebuilds the whole window if the table uses Full Refresh. Schedules are Hourly, Daily, Weekly, Monthly or Manual.
A table's structure is locked once it has data. Adding or removing a dimension or metric deletes the stored rows and syncs them again from the source. On a large backfill that can take a while, so settle the columns before the first big sync.
When a table syncs, every derived table built on it is queued to refresh automatically, so a Join of GA4 and Google Ads stays current without its own schedule.
Dimensions, metrics and the date column
Every column is one of three kinds:
- Date: the column the board's date picker filters on. File sources ask you to mark exactly one, or tick This file has no date column.
- Dimensions: text you group or filter by, such as channel, campaign or page path.
- Metrics: numbers that Lens adds up. Each metric has a type that decides how it aggregates.
| Metric type | How it aggregates | Example |
|---|---|---|
| sum | Adds values | sessions, cost |
| count | Counts rows | events |
| count_distinct | Counts unique values. Not additive: summing it across days or groups gives an upper bound, not an exact count | users |
| ratio | Sum of a numerator divided by sum of a denominator, computed after grouping | conversion rate = conversions / sessions |
| expression | Arithmetic over other metrics | cost per conversion |
| stored | A value produced by a Pivot table |
A metric can carry a display format: currency (with a currency code), percent or number, the number of decimals, and whether higher is better, lower is better, or neutral. Tiles use the direction to color changes green or red.
Column names keep their case when they are already plain letters, digits and underscores (activeUsers stays activeUsers). Anything else is lowercased with spaces turned into underscores (Active Users becomes active_users). Friendly display labels are set separately, in the table's Column Labels panel.
Boards and tiles
A tile picks a table, a metric, and optionally a Group By dimension and filters. Tiles follow the board's date range unless you give one its own. Tile results are cached for up to five minutes, and a new sync of the table clears the cache, so a board always reflects the latest synced data. See Build a Board and the tile reference.
Reports
A report shows the same tiles with the same numbers as the board, because both run the same queries. Viewers can change the date range and use board filters unless the board hides those controls. See Share Reports.
Dates and time zones
Every table records the time zone its dates are stored in, and boards show dates in your property's time zone. This matters most for file sources and hourly data; see Dates and Time Zones.