What it shows
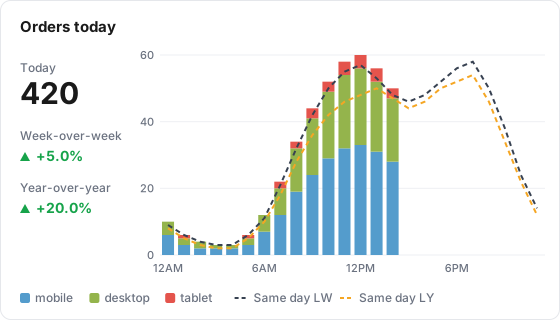
An Intraday tile answers "is today on track?" for one metric. Today's value is drawn as bars, one per hour from 12AM to 11PM. Two dashed lines show the same weekday last week and the same weekday last year. A panel on the left shows today's total so far and the change against both of those days, measured up to the current hour.
| Use it for | Not for |
|---|---|
| Watching a launch, sale or campaign day as it happens | Any day other than today (the tile is always pinned to today) |
| Spotting a tracking outage within hours rather than days | Sources that only deliver daily totals |
| Comparing today's shape with a normal day | Week or month views (use a Comparison tile) |
Example
Your table holds event-level rows with a timestamp, a device_category dimension and an orders metric. It is 2:40 PM on Thursday, Oct 29, 2026, in the property's time zone.
| Setting | Value |
|---|---|
| Type | Intraday |
| Data Table | site_events |
| Metric | orders |
| Stack Bars By | device_category |
The left panel reads "Today" with 420, then "Week-over-week" +5.0% and "Year-over-year" +20.0%:
| Day | Orders, 12AM through the 2PM hour | Change |
|---|---|---|
| Today, Oct 29, 2026 | 420 | |
| Oct 22, 2026 (Same day LW) | 400 | +5.0% |
| Oct 30, 2025 (Same day LY) | 350 | +20.0% |
The chart shows stacked bars for each hour up to 2PM, split into mobile, desktop and tablet, with a legend under the chart. The two dashed lines run across all 24 hours, so you can see how the rest of last week's and last year's day played out.
Data it needs
- One metric.
- Rows with a time of day, not just a date. Event-level sources such as Echo work. A source that stores only daily totals puts everything at 12AM, and the tile then shows a note saying so.
- At least 364 days of history for the year-over-year line and change. Without it they show "--".
Settings
| Setting | What it does | Default |
|---|---|---|
| Title | Name shown on the tile. Required, up to 80 characters | Empty |
| Description | Optional text behind an info icon on the tile, up to 500 characters | Empty |
| Size | Small, Third, Medium or Large. Medium or Large leaves room for 24 bars | Medium |
| Data Table | The Lens table the tile reads | None, required |
| Metric | The metric to chart | None, required |
| Filters | Limit the tile to matching rows. Applied to all three days. Several filters must all match | None |
| Stack Bars By | Optional dimension to split today's bars into stacked segments, such as device | None (single series) |
The Display tab has no options for this tile type: there is no Date range, because the tile is always today.
How it calculates
- Today. The calendar day in the property's time zone. Hours are the property's local hours too.
- The comparison days. Same day last week is today minus 7 days. Same day last year is today minus 364 days, so a Thursday is always compared with a Thursday.
- Headline. Today's total so far. Ratio and expression metrics are calculated from their summed parts. Unique counts such as users are counted once across the whole day, not added up hour by hour. Plain numbers of 10,000 or more are shortened, such as 27.2K or 1.4M.
- Week-over-week and year-over-year. Today so far against the comparison day from 12AM through the end of the current hour: (today - comparison) / comparison, to one decimal place. At 2:40 PM that is today up to now against the comparison day up to 2:59 PM. When the comparison day has nothing in that window, the change shows "--". Up is green and down is red.
- Bars. Today's value for each hour. Hours later today show no bar.
- Lines. The comparison days' value for each hour, across all 24 hours.
- Stacks. With Stack Bars By, the 5 largest values for today get their own segment and the rest are merged into "Other". An empty value shows as "(empty)". The comparison lines are always totals, never split.
What viewers can do
- Hover an hour to see today's value (or each stack) and both comparison days for that hour.
- Click a legend entry to hide or show a line or a stack segment.
- Change the board's filter chips. The tile follows them.
- The board's date picker and comparison picker do not affect this tile. A "Today" badge on the tile says so.
- The public report shows the same tile.
Limits and gotchas
- The changes run low early in each hour. The comparison days include the whole current hour while today has only part of it. At 2:05 PM, today has five minutes of the 2PM hour against a full hour last week.
- Daily sources do not work. Everything lands at 12AM. The tile shows "This table has no intra-day timestamps - all rows land at 12AM" once it can tell.
- Data delay shows up as a drop. If your source arrives with a lag, the last hour or two look low until the data lands.
- The change color ignores metric direction. Up is always green, even for a metric where lower is better.
- Holidays move. Same day last year is 364 days back, which keeps the weekday but not a date-based holiday.
- One metric only. There are no additional metrics and no Group By. Stack Bars By is the only split.