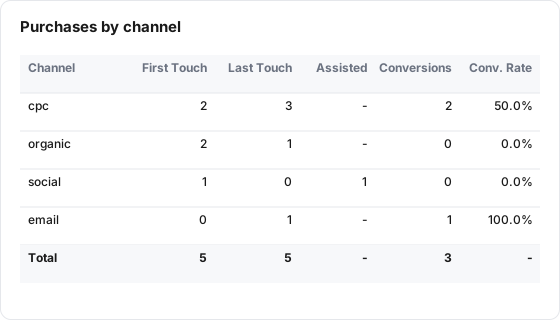
What it shows
The Attribution tile is a table with one row per channel. For each channel it counts the users who first arrived through it, the users whose latest row was through it, the users it assisted in between, and the conversions credited to it. Conversions use a last-touch rule: each converting user is credited once, to the channel on their latest row in the date range.
| Use it for | Not for |
|---|---|
| Telling awareness channels (high first touch) from closing channels (high last touch) | Fractional or data-driven credit (only first touch, last touch and assisted are counted) |
| A quick last-touch conversion count per channel from your own event data | Revenue attribution (it counts users, not order value) |
| Spotting channels that mostly appear mid-journey | Showing full paths in order (use Journey or Flow) |
Example
An events table has these columns:
| Column | Example values |
|---|---|
client_id (user key) | U1, U2 |
utm_medium | cpc, organic, social, email |
event_name | page_view, purchase |
Five users have these rows in the date range, in time order:
| User | Rows (utm_medium, event_name) |
|---|---|
| U1 | cpc, page_view; email, page_view; email, purchase |
| U2 | organic, page_view; cpc, purchase |
| U3 | cpc, page_view |
| U4 | organic, page_view; social, page_view; cpc, purchase |
| U5 | social, page_view; organic, page_view |
| Setting | Value |
|---|---|
| Type | Attribution |
| User Key | client_id |
| Channel Dimension | utm_medium |
| Conversion Event Dimension | event_name |
| Conversion Event Value | purchase |
| Show Total Row | On |
The tile shows:
| Channel | First Touch | Last Touch | Assisted | Conversions | Conv. Rate |
|---|---|---|---|---|---|
| cpc | 2 | 3 | - | 2 | 50.0% |
| organic | 2 | 1 | - | 0 | 0.0% |
| social | 1 | 0 | 1 | 0 | 0.0% |
| 0 | 1 | - | 1 | 100.0% | |
| Total | 5 | 5 | - | 3 | - |
cpc gets 2 conversions (U2 and U4, whose last row was cpc). U1's purchase goes to email, even though U1 arrived through cpc. Social assisted U4, who started on organic and finished on cpc. cpc's rate is 2 conversions out of the 4 users who touched cpc.
Data it needs
- A user key that identifies a person across rows.
- A channel dimension, such as
utm_medium,utm_sourceor a channel grouping column, filled on the rows people arrive with. - A conversion event dimension and the value that marks a conversion, such as
event_name=purchase. - A real event time on each row, so rows can be put in order. Rows are ordered by their timestamp.
Rows with an empty channel are counted under (not set).
Settings
| Setting | What it does | Default |
|---|---|---|
| Title | The tile header. Required | Empty |
| Description | Optional text behind an info icon | Empty |
| Type | Attribution | KPI |
| Size | Small, Third, Medium or Large | Medium |
| Data Table | The table to read | None |
| User Key | The dimension that identifies a user. Required | None |
| Channel Dimension | The dimension that holds the channel. Required | None |
| Conversion Event Dimension | The dimension that holds the event name. Required | None |
| Conversion Event Value | The exact value that counts as a conversion, such as purchase. Required | Empty |
| Cohort (optional) | Limits the tile to users in one cohort built on the same table | All users (no cohort) |
| Date range | Shown in the editor, but this tile always follows the board's date range | Inherit from board |
| Show Total Row | Adds a Total row on the board | On |
There is no attribution model picker and no lookback window: the rules below are fixed.
How it calculates
Lens reads every row of the table in the board's date range (only cohort users, when a cohort is set) and builds one summary per user:
| Per user | Rule |
|---|---|
| First touch | The channel on the user's earliest row |
| Last touch | The channel on the user's latest row in the range |
| Channels touched | Every distinct channel on any of the user's rows |
| Converted | The user has at least one row where the conversion dimension exactly equals the conversion value |
Then, for each channel the user touched:
| Column | Counts |
|---|---|
| First Touch | Users whose first touch is this channel. All users, converted or not |
| Last Touch | Users whose last touch is this channel. All users, converted or not |
| Assisted | Users who touched this channel when it was neither their first nor their last touch. All users, converted or not. Zero shows as - |
| Conversions | Converted users whose last touch is this channel |
| Conv. Rate | Conversions divided by every user who touched this channel, to one decimal |
Rows are sorted by the number of users who touched the channel, largest first. Every user lands in exactly one First Touch and one Last Touch cell, so those two columns each add up to the number of users. Conversions add up to the number of converted users.
The Total row sums First Touch, Last Touch and Conversions. Assisted and Conv. Rate show - in it.
Matching on the conversion value is exact and case-sensitive. If no rows match the range, the board shows "No attribution data found" and the public report shows "No data available".
What viewers can do
| Action | Board | Public report |
|---|---|---|
| Read the table | Channel rows, plus the Total row when Show Total Row is on | Channel rows only, no Total row |
| Info icon | Shows the tile description | Same |
| "How to read this" icon | Opens a short guide to the columns | Not shown |
| AI button | Summarizes the table, when AI features are on for the property | Not shown |
| Change the date range | The tile reloads | Same |
The table cannot be sorted or exported.
Limits and gotchas
- Last touch is the latest row in the range, not the latest row before the conversion. If a user buys and then comes back through another channel inside the same range, the conversion is credited to that later channel. Keep the range tight around the conversions you are studying.
- First touch is the earliest row in the range. A user who first arrived before the range starts is measured from their first row inside it. Longer ranges give truer first touches.
- First Touch, Last Touch and Assisted include people who never converted. Only the Conversions and Conv. Rate columns are about converters.
- The conversion row itself counts as a touch. Its channel value is used like any other row, so a purchase row carrying a channel can be the user's last touch.
- Board filter chips do not apply, and the tile's own Date range setting is ignored: the tile always uses the board's range. Use a cohort to narrow the users.
- Dates are the table's stored dates. For sources stored in UTC, such as Echo, the range is matched on the UTC date. See Dates and Time Zones.
- Rows with an empty user key count as one user. Use a user key that is always filled.
- Errors look like no data on the board. A failed query shows "No attribution data found" rather than the error.
- The public report has no Total row, whatever Show Total Row is set to.