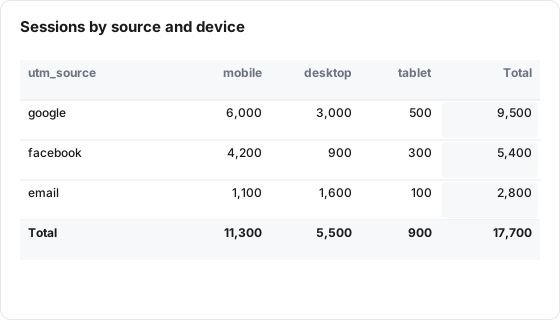
A Cross-tab tile is a grid of one metric: rows by one dimension, columns by another, with row, column and grand totals.
Illustration with the numbers from the Example below
What it shows
A Cross-tab tile splits one metric two ways at once. Group By gives the rows and Columns gives the columns, so each cell is the metric for one row value and one column value, such as sessions by source and device. The 8 largest columns are shown and the rest are folded into one "Other" column.
Use it for
Not for
One metric by two dimensions: source by device, campaign by region
A comparison against an earlier period (Cross-tab has no Compare To)
A month-by-category grid when Columns is a date or period
Dimensions with hundreds of values on both sides
Example
Your table has the dimensions utm_source and device_category and the metric sessions.
Setting
Value
Type
Cross-tab
Data Table
web_sessions
Metric
sessions
Group By
utm_source
Columns
device_category
Show Total Row
On
Sort by
Auto (recommended)
Columns run by their total, largest first. Rows run by their row total, largest first:
utm_source \ device_category
mobile
desktop
tablet
Total
google
6,000
3,000
500
9,500
facebook
4,200
900
300
5,400
email
1,100
1,600
100
2,800
Total
11,300
5,500
900
17,700
Data it needs
One metric.
Two different dimensions: one for Group By (rows) and one for Columns. The editor refuses to save if either is missing or both are the same.
Group By can be a dimension, a derived dimension or a custom grouping. Columns can be a dimension or a derived dimension, not a custom grouping.
Settings
Setting
What it does
Default
Title
Name shown on the tile. Required, up to 80 characters
Empty
Description
Optional text behind an info icon on the tile, up to 500 characters
Empty
Size
Small, Third, Medium or Large
Medium
Data Table
The Lens table the tile reads
None, required
Metric
The one metric in every cell
None, required
Group By
The dimension for the rows. Required
None
Columns
The dimension for the columns. Required
None
Join with Table (optional), Join Key(s), Additional Metrics from Joined Table
Join a second table to this tile. Board only, see Limits below
No join
Date range
Inherit from board (default), Ignore (all available data), Relative range or Fixed dates, with the same relative choices as other tiles
Inherit from board
Show Total Row
Adds a Total column on the right and a Total row at the bottom
On
Abbreviate large numbers
Shows 4.3M, 686K and so on. Hover a cell for the exact number
Off
Sort by
Auto (recommended), the Group By dimension, or the metric (by row total)
Auto
Rows to show
How many rows to keep, from 1 to 500
10
How it calculates
Cells. The tile groups the table by both dimensions over the date range. Ratio and expression metrics are calculated per cell from their parts, and again from the summed parts for every total, so a conversion rate total is never an average of rates.
Columns. Column values are ranked by their column total, largest first. When every column value is a date, or the column dimension is set as numeric on the table, they run in order instead. The first 8 are shown. Any beyond that are merged into one "Other" column, calculated from the merged rows, and a note under the grid says how many values it holds.
Rows, Auto. Rows run oldest to newest when Group By is a date or period (or set as numeric on the table). Otherwise they run by row total, highest first.
Rows, chosen. Sorting by the dimension runs A to Z. Sorting by the metric runs by row total, highest first. The editor has no Direction choice for this tile type.
Row limit. After sorting, the first Rows to show rows are kept. There is no "Other" row for rows that are cut.
Totals. The Total column is each row's total across every column value, Other included. The Total row and the grand total are calculated from every row the query returned, including rows cut by the row limit.
Blank values. An empty row or column value shows as "(not set)". A cell with no data shows 0.
No data. The board shows an empty grid. The public report shows "No data available".
What viewers can do
Hover an abbreviated number to see the exact value.
Change the board's dates and filter chips. Tiles set to Inherit follow them.
The board-level comparison picker has no effect on this tile type.
The public report shows the same grid. Column headers cannot be clicked to re-sort.
Limits and gotchas
The Total row can be larger than the rows above it. It counts rows cut by Rows to show. Raise the limit if the grid must add up on screen.
Unique counts are added up in totals. For a count-distinct metric such as users, the totals sum the cells, so a person seen on mobile and desktop counts twice in the row total.
No tile filters in the editor. The Filters section does not appear for Cross-tab. To narrow it, use board filter chips, or point the tile at a table that already holds only the rows you want.
A 5,000-row ceiling. The tile fetches at most 5,000 row-and-column combinations, taken by the metric, highest first. Very wide grids lose their smallest combinations.
Columns are capped at 8 plus Other in the editor.
Joins are applied on the board only. The public report ignores the join and shows the main table alone, and a joined tile on the board uses the board's dates only. Build a Join table instead.