What it shows
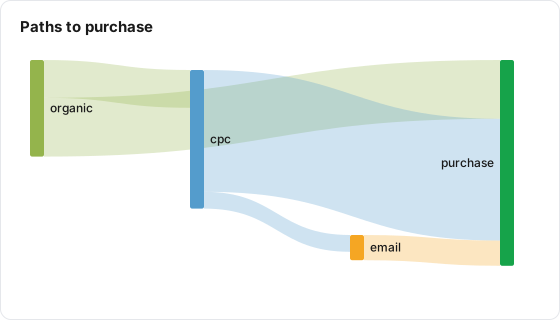
The Journey tile is a Sankey diagram. It takes every user who converted in the date range, lists the channels they came through in the order they first appeared, and draws a link for each step from one channel to the next. Each user's last channel links to a final node named after your conversion event. Link width is the number of users.
| Use it for | Not for |
|---|---|
| Seeing which channel usually comes before which, for converting users | Users who did not convert (they are left out) |
| Spotting single-channel conversions against multi-channel ones | Following one person's full path across many steps (each link is a single step) |
| A quick view straight from an event table, with no attribution table to build | Paths you have already built as a column (use Flow) |
Example
An events table has client_id (the user key), utm_medium and event_name. In the date range, the users who purchased came through these channels, in this order:
| Channels, in order of first appearance | Converting users |
|---|---|
| cpc | 200 |
| organic, then cpc | 90 |
| organic | 140 |
| cpc, then email | 40 |
| 20 |
| Setting | Value |
|---|---|
| Type | Journey |
| User Key | client_id |
| Channel Dimension | utm_medium |
| Conversion Event Dimension | event_name |
| Conversion Event Value | purchase |
The tile draws these links:
| From | To | Users |
|---|---|---|
| cpc | purchase | 290 |
| organic | purchase | 140 |
| organic | cpc | 90 |
| purchase | 60 | |
| cpc | 40 |
cpc to purchase is 290: the 200 cpc-only users plus the 90 who ended on cpc after organic. Hovering over a link on the board shows, for example, "organic to cpc, 90 users". The purchase node is green.
Data it needs
- A user key that identifies a person across rows.
- A channel dimension, such as
utm_mediumorutm_source. - A conversion event dimension and the value that marks a conversion.
- A real event time on each row, so channels can be put in order.
Rows with an empty channel are shown as (not set), drawn in grey.
Settings
| Setting | What it does | Default |
|---|---|---|
| Title | The tile header. Required | Empty |
| Description | Optional text behind an info icon | Empty |
| Type | Journey | KPI |
| Size | Small, Third, Medium or Large | Medium |
| Data Table | The table to read | None |
| User Key | The dimension that identifies a user. Required | None |
| Channel Dimension | The dimension that holds the channel. Required | None |
| Conversion Event Dimension | The dimension that holds the event name. Required | None |
| Conversion Event Value | The exact value that counts as a conversion. It also names the final node. Required | Empty |
| Cohort (optional) | Limits the tile to users in one cohort built on the same table | All users (no cohort) |
| Date range | Shown in the editor, but this tile always follows the board's date range | Inherit from board |
How it calculates
- Converters. Lens finds the users with at least one row in the board's date range where the conversion dimension exactly equals the conversion value. With a cohort, only cohort users are kept.
- Channels per user. For each converter it takes every row in the range and keeps each distinct channel once, at the time it first appeared. Empty channels become (not set).
- Order. The channels are numbered by that first-appearance time.
- Links. Each pair of consecutive channels becomes a link, counted in distinct users. Each user's last channel links to the conversion node.
- Cut-off. Links are added up across users and the 100 largest are kept.
Each channel appears at most once per user, so a user who went cpc, organic, cpc counts as cpc then organic. All of a converter's rows in the range are used, including rows after the conversion.
If no user converted in the range, the board shows "No journey data found" and the public report shows "No data available".
What viewers can do
| Action | Board | Public report |
|---|---|---|
| Hover a link | From, to, and the number of users | From, to, and the number |
| Hover a node | The channel name, and its links are highlighted | Same |
| Info icon | Shows the tile description | Same |
| "How to read this" icon | Opens a short guide to the diagram | Not shown |
| AI button | Summarizes the diagram, when AI features are on for the property | Not shown |
| Change the date range | The tile reloads | Same |
Nodes cannot be dragged or clicked, and there is no export.
Limits and gotchas
- One link is one step. The diagram counts pairs of consecutive channels. It cannot show that the users on one link are the same users on the next.
- A channel can appear more than once. When a channel is both reached from another channel and leads on to another, the diagram draws it as separate nodes with the same name, so it never loops. Hover the links to read the counts.
- Only the 100 largest links are drawn. Rare paths drop out on busy tables.
- Order is by first appearance, and repeats are dropped. Returning through a channel the user already had does not add a step.
- Rows after the conversion count. A channel a converter first used after buying still appears in their sequence. Keep the range tight around the conversions you are studying.
- The public report colors the final node green only when the conversion value is
purchase. On the board it is green for any conversion value. The report can also split repeated channels into nodes differently from the board, so the two drawings may not match node for node, although the link counts are the same. - Board filter chips do not apply, and the tile's own Date range setting is ignored: the tile always uses the board's range. Use a cohort to narrow the users.
- Dates are the table's stored dates. For sources stored in UTC, such as Echo, the range is matched on the UTC date. See Dates and Time Zones.
- Rows with an empty user key count as one user. Use a user key that is always filled.