What it shows
The Retention tile is a cohort matrix. Each row is a group of members who started in the same month, week or day (or, if you choose, one value of a dimension). Each column is a period since they started. A cell shows the share of that row still retained at that period, or, if you choose, the share churned, the share cancelled, a count, or value earned per member. You can draw it as a shaded grid or as one line per row.
| Use it for | Not for |
|---|---|
| Subscription, contract or membership retention from start and end dates | A single retention number for a KPI tile |
| Repeat purchase or return-visit rates from event rows | Step-by-step conversion (use Funnel) |
| Lifetime value per member over time, from an orders table | Revenue totals by date (use a Line or Table tile) |
Example
A subscriptions table has one row per subscription:
| Column | Example values |
|---|---|
subscription_id (member ID) | S-1001 |
started_at | 2026-01-12 |
cancelled_at | 2026-03-03, or empty while active |
plan | monthly, annual |
| Setting | Value |
|---|---|
| Mode | Lifecycle |
| Member ID | subscription_id |
| Start date | started_at |
| End date | cancelled_at |
| Cohort by | Month |
| Periods in | Months |
| Columns | Every period |
| Number of periods | 3 |
| Show | % retained |
| Size column label | Subscriptions |
| View | Grid |
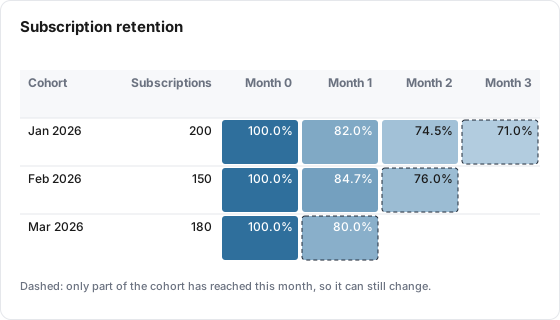
With the board set to January 1 to March 31, 2026, and today being April 15, 2026, the tile shows:
| Cohort | Subscriptions | Month 0 | Month 1 | Month 2 | Month 3 |
|---|---|---|---|---|---|
| Jan 2026 | 200 | 100.0% | 82.0% | 74.5% | 71.0% * |
| Feb 2026 | 150 | 100.0% | 84.7% | 76.0% * | |
| Mar 2026 | 180 | 100.0% | 80.0% * |
Month 1 for January is 164 of 200 still active one calendar month after their own start. Cells marked * have a dashed outline: only part of the cohort has reached that month so far (for Jan 2026, Month 3 counts only the members who started January 1 to 15), so the number can still move. Blank cells mean no one in the cohort has reached that month yet.
Data it needs
The tile reads an ordinary table. You map its fields in the editor. There are two modes:
| Mode | The table has | A member is retained in a period when |
|---|---|---|
| Lifecycle | One row per member, with a start date and an end date (empty while active) | Their end date is empty, or not before the start of that period |
| Activity | Many rows per member, such as orders or visits | They have at least one qualifying row inside that period |
Dates can be text values in the table, such as 2026-03-01 or 2026-03-01 06:09:05. A date without a time zone is read in your property's time zone. A date with an offset, such as Z or +02:00, is read as the exact moment it names. Rows whose member ID is empty are ignored.
Settings
| Setting | What it does | Default |
|---|---|---|
| Title, Description, Size | As on other tiles | Medium |
| Data Table | The table to read | None |
| Mode | Lifecycle (one row per member, start and end date) or Activity (many rows per member) | Lifecycle |
| Member ID | The field that identifies one member. Each member is counted once. Required | None |
| Start date | When the member started; picks their cohort. Required in Lifecycle. Optional in Activity, where empty means the member's first row | None |
| End date | Lifecycle only. When the member ended; empty means still active. Required | None |
| Activity date | Activity only. The date that places a row in a period | Row date (event time) |
| Counts as active when ... equals | Activity only. A dimension and value a row must have to count, such as event_name equals purchase | Any row |
| Cohort by | Month, Week or Day: how members are grouped into rows by start date | Month |
| Periods in | Months, Weeks or Days: the unit of each column | Months |
| Columns | Lifecycle only. Every period (Month 1, 2, 3...) or Custom windows (0-3, 3-6, 6-12, 12+) | Every period |
| Number of periods | Columns after period 0. 1 to 60 months, 104 weeks or 90 days | 12 |
| Window breakpoints | With custom windows. Up to 10 increasing whole numbers in the period unit, such as 3, 6, 12 | Empty |
| Show | % retained, % churned, Members retained, % cancelled during (Lifecycle only), Value per member and Cumulative value (need a value table) | % retained |
| Value table (optional) | A second table of the same property, such as orders, whose value is added up per member | None |
| Member ID on the value table | The value table field holding the member ID. Required with a value table | None |
| Value | The value table metric to add up. Only stored, summable metrics are listed. Required with a value table | None |
| Value date | The value table date that places value in a column | Row date |
| Divide by | Members, or the distinct values of a field on the retention table (such as a customer ID) | Members |
| Size column label (optional) | The header of the size column, up to 60 characters | Size |
| Rows | Start cohort (one row per start period), a dimension of the table, or a custom grouping of it | Start cohort |
| Rows shown | With rows by a dimension. The largest rows are shown; the rest are pooled into "Other". 1 to 50 | 10 |
| Minimum members per cell | With rows by a dimension. Cells resting on fewer members are greyed out and show their count | 30 |
| View | Grid (shaded table) or Curve (one line per row) | Grid |
| Cohort (optional) | Limits the tile to members in one cohort built on the same table | All users (no cohort) |
| Filters | Tile filters on the table's rows, with + Add Filter. Several filters must all match | None |
| Date range | Shown in the editor, but this tile always follows the board's date range | Inherit from board |
Switching to Activity mode resets Columns to Every period and a % cancelled during display to % retained, because both need an end date.
How it calculates
Members and cohorts. Lens collapses the table to one entry per member ID. In Lifecycle mode the start is the member's earliest start date and the end is their latest non-empty end date. The member's cohort is the month, week or day of their start, in your property's time zone. Week cohorts begin on your property's first day of the week. The Size column is the number of distinct members in the row.
Which rows appear. The board's date range selects members by start date. Only members who started inside the range appear. It never cuts off their later periods: a January cohort keeps showing Month 6 even when the range ends in March. Rows are read from the whole table, not just the range.
Periods. Period N is a calendar period counted from each member's own start: Month 1 for a January 31 start is February 28 (or 29). Periods are not blocks of 30 days.
Who counts in a cell. A cell counts only members whose period N has already been reached today. If no member of the row has reached it, the cell is blank, never 0%. If only some have, the cell is in progress, marked * with a dashed outline, and computed over those members only.
| Show | Cell value |
|---|---|
| % retained | Retained members divided by members who have reached the period, to one decimal |
| % churned | 100 minus % retained |
| Members retained | The count of retained members |
| % cancelled during | Members whose end date falls inside that period (for period 1, any time before its end), divided by members who have reached it |
| Value per member | Value earned in that column, divided by the members (or the Divide by values) who have completed it |
| Cumulative value | Value from the start through the end of that column, per member |
Retained, by mode:
| Mode | Retained at period N |
|---|---|
| Lifecycle, every period | End date empty, or on or after start plus N periods. Period 0 is always 100% |
| Lifecycle, custom windows | End date empty, or on or after the end of the window. The last window ("12+ to date") counts members still active today |
| Activity | At least one qualifying row on or after start plus N periods and before start plus N+1 periods |
Custom windows. Breakpoints 3, 6, 12 give the columns 0-3, 3-6, 6-12 and "12+ to date". The last window runs to today, so it grows as a row ages. A window is reached once its end has passed; the last window is reached as soon as a member enters it.
Rows by a dimension. Each member takes the value from their earliest row, so a member who changed plan is counted once, where they started. Rows sort numerically when every value is a number (30, 60, 90), otherwise by size, largest first. "(not set)" and "Other" come last. Each cell pools every member in the row who has reached that period, so the counts are added up before any percentage is taken.
Value. Value rows are matched to members on Member ID on the value table, and placed in a column by their value date, counted from the member's start date. A value dated exactly on a column boundary belongs to the later column. A member counts in a value column only after they have completed it, and only if the value table has data from the column's start. On start-cohort rows, a column that starts before the value table's first date shows - rather than an undercount.
If no member started in the range, the tile shows "No cohorts started in this date range" on both the board and the public report.
What viewers can do
| Action | Board | Public report |
|---|---|---|
| Read the grid | Shaded cells with a legend that explains the display, the * cells and grey cells | Same |
| Read the curve | One line per row, ending at the last period reached. In-progress points are hollow | Same |
| Info icon | Shows the tile description | Same |
| "How to read this" icon | Opens a short guide to the matrix | Not shown |
| AI button | Summarizes the matrix, when AI features are on for the property | Not shown |
| Board filter chips | Applied, for chips whose dimension the table has | Same |
| Change the date range | Picks which cohorts appear | Same |
Grid or curve is set in the editor; viewers cannot switch it. A % cancelled during tile always draws the grid. The curve plots % retained (or % churned), so a Members retained tile plots % retained on the curve. The value displays plot cumulative value.
Limits and gotchas
- The date range picks cohorts, not activity. A one-month range shows one monthly cohort, with all of its later months. To see more cohorts, widen the range.
- The tile's own Date range setting is ignored. The tile always uses the board's range, on the board and in the public report.
- Blank is not zero. A blank cell means nobody has reached that period yet. Read across older rows for complete numbers, and treat
*cells as provisional. - Lifecycle reads one membership per member ID. If an ID has several rows, the earliest start and the latest end date on any row are used, even when a later row has no end date. A member who cancelled and rejoined under the same ID therefore counts as ended at that end date. Give each membership its own ID if you need them counted separately.
- Activity period 0 is not forced to 100%. With a Counts as active when condition, a member whose first row did not qualify can show as not retained in period 0.
- Limits: up to 60 monthly, 104 weekly or 90 daily periods, 10 window breakpoints, and 50 rows shown. See Limits.
- Grey cells appear only when Rows is set to a dimension or grouping. Lower Minimum members per cell to 0 to turn them off.
- Dates without a time zone are read in your property's time zone. A start written as
2026-03-01is March, even when the table is stored in UTC.