What it shows
A bar tile shows a metric over time as columns, one per day, week or month. With a Group By, each period gets one column per value, side by side, or one stacked column when Stacked is on. It reads the same data as a Line tile and only draws it differently.
| Use it for | Not for |
|---|---|
| Totals per week or month | Ranking channels or campaigns. Bars always run along a date axis; use a Table |
| How a few groups make up each period (stacked) | Long daily ranges with many groups, which crowd the axis |
| Columns by group with the overall total as a line | This year against last year by month. Use Monthly YoY |
Example
A table of daily campaign results has one row per day and campaign:
| Column | Kind | Example |
|---|---|---|
date | date | 2026-08-12 |
campaign | dimension | back_to_school |
conversions | metric (sum) | 21 |
In the tile editor:
| Setting | Value |
|---|---|
| Title | Conversions by campaign, last quarter |
| Type | Bar |
| Data Table | Daily campaign results |
| Metric | conversions |
| Group By | campaign |
| Date range | Relative range, Last quarter |
| Bucket by | Month |
| Stacked | On |
| Size | Medium |
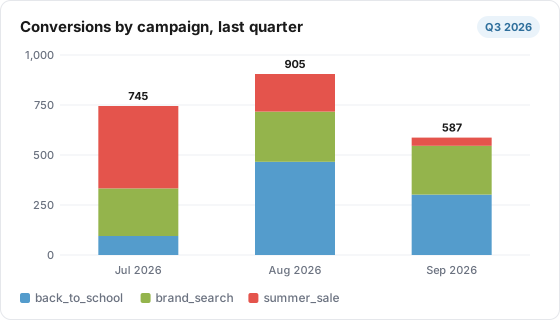
With today in October 2026, Last quarter is July 1 to September 30. The tile draws three stacked columns:
| Month | back_to_school | brand_search | summer_sale | Column height |
|---|---|---|---|---|
| Jul 2026 | 95 | 238 | 412 | 745 |
| Aug 2026 | 466 | 251 | 188 | 905 |
| Sep 2026 | 302 | 244 | 41 | 587 |
The legend lists back_to_school (863 in total), brand_search (733) and summer_sale (641), largest first. A badge on the tile header reads "Q3 2026", because the tile uses its own date range.
Data it needs
- A metric. Ratio and calculated metrics are worked out per bucket.
- A date on each row. Every synced Lens table has one, so time is always the horizontal axis.
- For Group By, a dimension on the table or a custom grouping.
Settings
| Setting | What it does | Default |
|---|---|---|
| Title | The tile heading. Required, up to 80 characters | Empty |
| Description | Text behind an info icon on the tile, up to 500 characters | Empty |
| Size | Small, Third, Medium or Large | Medium |
| Data Table | The table to read. Required | None |
| Metric | The first (or only) set of bars. Required | None |
| Additional Metrics | Adds one set of bars per extra metric, in the order shown. Drag a chip to reorder. Skipped when Group By is set | None |
| Group By | One set of bars per value of a dimension or grouping | None (total only) |
| Filters | Limits the rows the tile counts. Several filters must all match | None |
| Join with Table (optional) | Combines a second table on shared dimensions. See the limits below | No join |
| Date range | Inherit from board, Ignore (all available data), Relative range, or Fixed dates | Inherit from board |
| Bucket by | Auto (recommended), Day, Week or Month | Auto |
| Compare overlay | None, Previous period (matching window), Previous year (full Jan-Dec), or Previous N years (full Jan-Dec each) | None |
| How many years back | For Previous N years: 1 to 10, one set of bars per year | 2 |
| Compare To | Adds the prior window as grey bars beside the current ones. Options as on the KPI tile | None |
| Stacked | Stacks the bars into one column per period. Shown when Group By or Additional Metrics is set | Off |
| Show total as a line | With Group By: draws the total of every value as a line over the bars | Off |
| Line name | The legend name of the total line | Total |
| Thresholds (optional) | Under Health monitoring: Alert below, Warn below, Warn above, Alert above | Empty |
| Stopped-moving alerts | Alert after N days at exactly zero, or N days unchanged (1 to 60) | Empty |
| Flag anomalies automatically | Flags the latest day when it falls outside a normal range learned from the tile's own days | Off |
| Sensitivity | High, Medium (recommended) or Low | Medium |
| Weekly pattern | Compare like-for-like weekdays (recommended), or ignore the weekly pattern | Like-for-like |
How it calculates
A bar tile uses the same math as a line tile:
- Buckets. Rows are added up per day, week or month. Ratio and calculated metrics are worked out once per bucket from their parts.
- Auto grain. The board's default trend grain if it has one. Otherwise day for ranges up to 120 days, week for 121 to 365 days, and month for longer ranges or a year-style overlay.
- Weeks start on Monday and are labeled with that Monday's date. Months read like "Sep 2026".
- Empty buckets plot as 0. Every period in the range gets a slot, even with no rows.
- Group By. Groups are ranked by the metric's total over the range and only the top 6 are drawn, with no "Other". Empty values show as "(not set)". The total line counts every value.
- Stacked. A column's height is the sum of the groups drawn. With more than 6 values it is lower than the true total; turn on Show total as a line to see the full figure.
- Order of precedence. Group By wins over Additional Metrics. Compare To applies only to a single set of bars. Comparison bars are never stacked onto the current ones.
- Compare overlay. Previous period: one set of bars per period on a "Day 1, Day 2, ..." axis. Previous year or N years: one set per year on a January to December axis, by month unless you pick another grain, with the current year to date when Date range is Inherit.
- Rounding. Values are rounded to two decimals and formatted with the metric's format.
- Health. Checks judge the most recent day in the tile's data, using the total of the first metric. See the Line tile for the detail.
- No data. On the board the axis shows with no bars. On the public report the tile reads "No data available".
What viewers can do
| Action | Board | Public report |
|---|---|---|
| Hover a column | Shows every series' value for that period | Same |
| Click a legend entry | Hides or shows that series; a stacked column redraws without it | Same |
| Change dates, compare, filters | Board picker, board comparison and filter chips | Same, unless the board hides them |
| Read the description | Info icon | Info icon |
| See health | Colored dot, with the reason on hover | Same |
| Summarize with AI | When AI features are on for the property | No |
Limits and gotchas
- Bars always run along time. There is no "bar by category" mode in the editor; a bar tile grouped by campaign still has dates on the axis. To rank campaigns, use a Table or a Donut.
- Only 6 groups are drawn, and a stacked column only adds up the groups drawn.
- Daily bars get thin. Columns are capped at a narrow width, and a 90-day daily range with groups is hard to read. Pick Bucket by Week or Month.
- Compare To is silently skipped with Group By or Additional Metrics, and it is measured from the board's date range, even when the tile has its own range.
- Compare overlay ignores Group By, Additional Metrics, Stacked and the total line. It plots the first metric only.
- Additional metrics share one axis, formatted like the first metric.
- First and last buckets can be partial, so a range that starts mid-month shows a short first column.
- Derived dimensions do not split a bar tile. Grouping by one draws a single "(not set)" series. Use a stored dimension or a custom grouping.
- Very large breakdowns can be cut. The tile reads up to 5,000 rows (one per day and group value), largest first.
- Joins are board-only. The public report ignores Join with Table. See Join Tables.