What it shows
A donut tile splits one metric across the values of a dimension, such as sessions by device, and draws each value as a slice of a ring. With Compare To set, it draws a second donut for the earlier period beside the first.
| Use it for | Not for |
|---|---|
| A mix with a handful of values: device, new vs returning, channel group | Dimensions with many values. Only the top 8 slices are drawn |
| Sums and counts, such as sessions or orders | Rates and averages, which do not add up to a whole |
| Spotting a shift in mix against last period | Exact comparisons. Use a Table with Compare To |
Example
A table of daily web traffic has one row per day and device:
| Column | Kind | Example |
|---|---|---|
date | date | 2026-10-14 |
device_category | dimension | mobile |
sessions | metric (sum) | 812 |
The board date picker is set to the last 30 days. In the tile editor:
| Setting | Value |
|---|---|
| Title | Sessions by device |
| Type | Donut |
| Data Table | Daily web traffic |
| Metric | sessions |
| Group By | device_category |
| Size | Third |
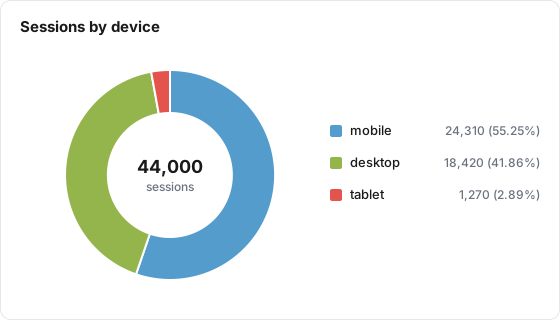
The tile draws three slices, largest first, with the legend on the right. Hovering a slice shows its value and share:
| Slice | Sessions | Hover shows |
|---|---|---|
| mobile | 24,310 | mobile: 24,310 (55.25%) |
| desktop | 18,420 | desktop: 18,420 (41.86%) |
| tablet | 1,270 | tablet: 1,270 (2.89%) |
The shares are each value divided by 44,000, the total of the slices.
Data it needs
- A metric that adds up: a sum or a count. Ratio metrics are allowed but a share of a rate means nothing.
- A Group By dimension, or a custom grouping. Without one the donut is a single full ring.
- A date on each row, so the tile can follow the date range.
Settings
| Setting | What it does | Default |
|---|---|---|
| Title | The tile heading. Required, up to 80 characters | Empty |
| Description | Text behind an info icon on the tile, up to 500 characters | Empty |
| Size | Small, Third, Medium or Large | Medium |
| Data Table | The table to read. Required | None |
| Metric | The metric to split. Required | None |
| Group By | The dimension whose values become slices. Not required by the editor, but needed for a useful donut | None (total only) |
| Filters | Limits the rows the tile counts. Several filters must all match | None |
| Join with Table (optional) | Combines a second table on shared dimensions. See the limits below | No join |
| Date range | Inherit from board, Ignore (all available data), Relative range, or Fixed dates | Inherit from board |
| Compare To | Adds a second donut for an earlier period: Previous Period, Same Day Last Week, Same Day Last Month, Same Day Last Year, or Same Week Last Year (-364d) | None |
The donut has no stacking, bucketing, health or abbreviation options.
How it calculates
- Slices. The metric is added up per value over the whole date range. Ratio and calculated metrics are worked out per value from their parts.
- Top 8. Values are ranked largest first and only the top 8 become slices. The rest are left out, with no "Other" slice. If the dimension has a numeric display format on the table, the 8 slices are then ordered by value (30, 60, 90) instead.
- Shares. The percentage on hover is the slice's share of the slices drawn, to two decimals. With more than 8 values it is not the share of the full total.
- Empty values. Rows with no value for the dimension form one slice, "(not set)" or "(unknown)".
- Rounding. Slice values are rounded to two decimals and shown in the metric's format.
- Colors. A value keeps the same color on every tile and on the report, from the board's palette. See Brand Palettes.
- Compare To. Two donuts side by side: "Current" with its dates on the left, the comparison name and its dates on the right, one shared legend below. Each donut picks its own top 8. Hovering a slice also shows the same value's figure in the other period. A period with no rows shows "No data" under its title. The comparison windows are listed on the KPI page.
- No data. On the board the ring is empty. On the public report the tile reads "No data available".
What viewers can do
| Action | Board | Public report |
|---|---|---|
| Hover a slice | Value and share, plus the other period's value when comparing | Same |
| Click a legend entry | Hides or shows that slice; the shares recalculate over the slices left | Same |
| Change dates, compare, filters | Board picker, board comparison and filter chips | Same, unless the board hides them |
| Read the description | Info icon | Info icon |
| Summarize with AI | When AI features are on for the property | No |
A board comparison picked by a viewer turns a donut into the two-donut view.
Limits and gotchas
- Always set Group By. The editor saves a donut without one, and it then draws a single slice.
- More than 8 values loses data from view. The left-out values are not grouped into "Other", so the ring is only part of the total. Combine small values with a custom grouping, or use a Table with Show % of total.
- Hover shares are shares of the drawn slices, and they change when a viewer hides a slice with the legend.
- Do not use a rate. A donut of conversion rate by device adds rates together into a meaningless ring.
- Compare To is measured from the board's date range, even when the tile has its own range.
- Joins are board-only. The public report ignores Join with Table. See Join Tables.