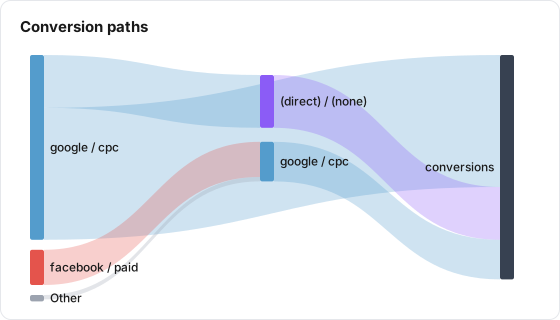
What it shows
The Flow tile is a Sankey diagram drawn from a path dimension: a column where each value is a whole journey, with steps joined by " > ". The first column of nodes is step 1 of every journey, the next is step 2, and so on, ending in one final node. Each band is sized by the metric you pick, such as conversions or revenue, and the hover text gives each flow's share of the total.
| Use it for | Not for |
|---|---|
| Showing how conversions from an attribution table move through step 1, step 2 and step 3 | Building paths from raw event rows (use Journey) |
| Sizing journeys by revenue or conversions rather than by users | Tables without a path column (the tile has nothing to draw) |
| A board-ready view of the same paths a Table tile lists | Exact counts per path (use a Table tile grouped by the path) |
Example
An attribution table has a path column and a conversions metric:
path_source_medium | conversions |
|---|---|
google / cpc | 300 |
google / cpc > google / cpc > (direct) / (none) | 120 |
facebook / paid > google / cpc | 80 |
newsletter / email > google / cpc | 10 |
| Setting | Value |
|---|---|
| Type | Flow |
| Metric | conversions |
| Group By | path_source_medium |
| Steps to show | 4 |
| Group small flows as "Other" below (%) | 2 |
| Final step name (optional) | Empty, so the final node is named after the metric |
The total is 510 conversions, so anything under 2% (10.2) at a step is grouped as Other. The tile shows these nodes:
| Node | Conversions | Share |
|---|---|---|
| Step 1: google / cpc | 420 | 82.4% |
| Step 1: facebook / paid | 80 | 15.7% |
| Step 1: Other | 10 | 2.0% |
| Step 2: (direct) / (none) | 120 | 23.5% |
| Step 2: google / cpc | 90 | 17.6% |
| conversions (final node) | 510 | 100.0% |
The repeated google / cpc > google / cpc counts as one step, so the 120 conversions go google / cpc, then (direct) / (none). newsletter / email (10, under 10.2) joins Other at step 1. The 300 single-step journeys flow straight from step 1 to the final node.
Data it needs
- A path dimension: each value is one journey, with steps separated by a space,
>and a space, such asgoogle / cpc > email / newsletter. A value that starts with... >(written by attribution tables when they keep only the last steps of a long journey) gets an Earlier steps node first. - A metric to size the bands, such as conversions or revenue. Paths whose value is zero or below are skipped.
Attribution tables built in Lens carry path columns of this shape. Any other table with a column in the same format works too.
Settings
| Setting | What it does | Default |
|---|---|---|
| Title | The tile header. Required | Empty |
| Description | Optional text behind an info icon | Empty |
| Type | Flow | KPI |
| Size | Small, Third, Medium or Large | Medium |
| Data Table | The table to read | None |
| Metric | Sizes the bands. Required | None |
| Group By | The path dimension. Required for Flow | None (total only) |
| Filters | Tile filters on the table's rows, with + Add Filter. Several filters must all match | None |
| Join with Table (optional) | Adds metrics from a second table, as on other standard tiles | No join |
| Steps to show | 2 to 8. Longer journeys keep their first steps | 4 |
| Group small flows as "Other" below (%) | 0 to 50. At each step, values carrying less than this share of the total merge into "Other". 0 keeps every value | 2 |
| Final step name (optional) | Names the final node, up to 40 characters | The metric's name |
| Date range | Inherit from board, Ignore, Relative range or Fixed dates. Unlike the user-level tiles, Flow honors this setting | Inherit from board |
How it calculates
- Lens totals the metric for each path value in the date range, after tile filters and board filter chips, and keeps the 5,000 largest paths.
- Each path is split on
" > ". Blank steps are dropped, and the same step repeated in a row counts once (a > a > bisa > b). - Each path keeps its first Steps to show steps. An Earlier steps node, when present, uses one of those slots.
- At each step position, a value whose total is below the Other threshold becomes "Other". The threshold is a share of the metric's total for the tile's whole range, not just the 5,000 paths fetched.
- A node is identified by its step position and value, so
google / cpcat step 1 and at step 2 are separate nodes and the diagram never loops. - Every path ends with a link from its last kept step to the final node.
Within each column, nodes are ordered largest first, with Other and Earlier steps at the bottom. A step value gets the same color wherever it appears, on the board and in the public report. Other, Earlier steps and the final node are grey.
If no path has a value above zero, the board shows "No journeys in this period. Check that Group By is a path dimension (steps joined by " > ")." The public report shows "No journeys in this period."
What viewers can do
| Action | Board | Public report |
|---|---|---|
| Hover a node | Step number, value, the metric and its share of the total | Same |
| Hover a band | From, to, the metric and its share of the total | Same |
| Info icon | Shows the tile description | Same |
| AI button | Summarizes the tile, when AI features are on for the property | Not shown |
| Board filter chips | Applied | Same |
| Change the date range | The tile reloads, unless it has its own date range | Same |
The board and the public report draw Flow with the same code, so they match. Nodes cannot be dragged or clicked.
Limits and gotchas
- Group By must be a path column. On an ordinary dimension, each value becomes a one-step journey and the diagram is just a split of the total.
- Separators need spaces. Steps must be joined by
" > ". A value such asa>bis read as one step. - Longer journeys are cut, not merged. With Steps to show at 4, steps 5 and later of a journey are not drawn; the band goes from step 4 to the final node.
- Only the 5,000 largest paths are fetched. Shares still divide by the full total, so the tail is not lost from the percentages, but its bands are not drawn.
- A metric that is a ratio or average does not add up along a path. Use a count or a sum, such as conversions or revenue.
- Other is per step. A value can be its own node at step 1 and fall into Other at step 2, where it is smaller.