What it shows
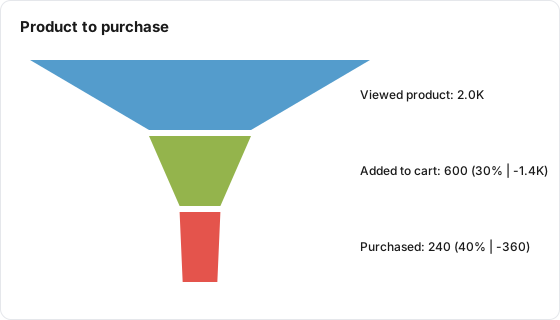
The Funnel tile draws one band per step you define, sized by the number of users who reached it. A step is a set of conditions on a single row, such as "event_name equals add_to_cart". Each step counts only the users who also matched every step above it, so the bands can only stay level or shrink. Labels show the rate from the previous step and how many users were lost.
| Use it for | Not for |
|---|---|
| Finding the step where most users drop out | Proving that steps happened in a given order (order is not checked, see below) |
| Comparing a funnel for a cohort against all users, on two tiles | Counting events or sessions per step (it counts users) |
| An end-to-end rate from first step to last | Time between steps (use Time to Conversion) |
Example
An events table has client_id (the user key) and event_name, with values such as view_item, add_to_cart and purchase.
| Setting | Value |
|---|---|
| Type | Funnel |
| User Key | client_id |
| Cohort (optional) | All users (no cohort) |
| Funnel Steps, step 1 | Name "Viewed product", condition event_name equals view_item |
| Funnel Steps, step 2 | Name "Added to cart", condition event_name equals add_to_cart |
| Funnel Steps, step 3 | Name "Purchased", condition event_name equals purchase |
The tile shows:
| Step | Users | Rate from previous step | Users lost |
|---|---|---|---|
| Viewed product | 2,000 | ||
| Added to cart | 600 | 30% | 1,400 |
| Purchased | 240 | 40% | 360 |
On the board, the labels read Viewed product: 2.0K, Added to cart: 600 (30% | -1.4K) and Purchased: 240 (40% | -360). Hovering over Purchased shows 240 users, "Conversion: 40% from previous step", "Drop-off: 360 users lost" and "Overall: 12% of step 1". In the public report the label reads Purchased: 240 (40%).
Data it needs
- A user key that identifies a person across rows.
- Dimensions that tell the steps apart, such as
event_name,page_pathorform_id. - One row per action, so a user who did several things has several rows. Each condition in a step is checked against one row at a time.
Settings
| Setting | What it does | Default |
|---|---|---|
| Title | The tile header. Required | Empty |
| Description | Optional text behind an info icon | Empty |
| Type | Funnel | KPI |
| Size | Small, Third, Medium or Large | Medium |
| Data Table | The table to read | None |
| User Key | The dimension that identifies a user. Required | None |
| Cohort (optional) | Limits the tile to users in one cohort built on the same table | All users (no cohort) |
| Funnel Steps | The steps, in order. At least 2. Click + Add Step to add one | None |
| Step name | Shown on the chart. Left blank, it becomes "Step 1", "Step 2" and so on | Blank |
| + Add Condition | Adds a condition to a step: a dimension, an operator and a value | One empty condition |
| Operator | equals, not equals, contains, not contains, begins with, ends with, regex | equals |
| Date range | Shown in the editor, but this tile always follows the board's date range | Inherit from board |
A condition needs both a dimension and a value, or it is dropped when you save. A step with no complete condition is dropped too, and the steps after it move up.
How it calculates
- Lens reads rows in the board's date range (only cohort users, when a cohort is set).
- For each step, it finds the users who have at least one row matching all of that step's conditions. The conditions in a step must match on the same row.
- Step 1's count is the users who matched step 1. Step 2's count is the users who matched step 1 and step 2. Step 3's count is the users who matched steps 1, 2 and 3, and so on.
- On the chart, the percentage is this step's users divided by the previous step's users, rounded to a whole number. The drop-off is the difference. The hover text also gives the share of step 1.
How the operators match:
| Operator | Matches when the row's value |
|---|---|
| equals, not equals | Is, or is not, exactly the value |
| contains, not contains | Includes, or does not include, the value anywhere |
| begins with, ends with | Starts or ends with the value |
| regex | Matches the regular expression anywhere in the value. Anchor it with ^ and $ for a whole-value match |
All operators are case-sensitive: Purchase does not match purchase.
If the query returns no rows, the board shows "No funnel data found" and the public report shows "No data available". If users exist but none match, the chart draws with zero counts.
What viewers can do
| Action | Board | Public report |
|---|---|---|
| Read the labels | Users per step, rate from the previous step and users lost | Users per step and rate from the previous step |
| Hover a step | Users, conversion from the previous step, drop-off and share of step 1 | Step label and users |
| Info icon | Shows the tile description | Same |
| "How to read this" icon | Opens a short guide to the funnel | Not shown |
| AI button | Summarizes the funnel, when AI features are on for the property | Not shown |
| Change the date range | The tile reloads | Same |
Large numbers in the labels are shortened, such as 1.4K or 2.1M.
Limits and gotchas
- Step order is not checked. A user counts at step 3 if they matched steps 1, 2 and 3 at any time in the range, in any order. Someone who bought first and viewed the product afterwards still counts as having completed the funnel. Treat the tile as "did all of these" rather than "did these in this order".
- There is no time limit between steps. Matching rows can be days apart, as long as they are in the date range.
- Conditions in one step must match one row. "event_name equals purchase" and "page_path contains /checkout" in the same step need a single row that has both. To accept either of two values of one dimension, use a regex such as
^(purchase|lead)$. - Matching is case-sensitive. This differs from pivot tables and groupings, which ignore case.
- Board filter chips do not apply, and the tile's own Date range setting is ignored: the tile always uses the board's range. Use a cohort or a step condition to narrow it.
- Dates are the table's stored dates. For sources stored in UTC, such as Echo, the range is matched on the UTC date. See Dates and Time Zones.
- Rows with an empty user key count as one user at each step they match.