What it shows
A KPI tile shows one metric, added up over the whole date range, as a single number. It can also show how that number changed against an earlier period, and what share it is of a larger total.
| Use it for | Not for |
|---|---|
| Headline totals: sessions, orders, revenue, conversion rate | Trends over time. Use a Line or Comparison tile |
| A quick "up or down against last period" check | Breaking a number down by channel, campaign or device. KPI has no Group By |
| A filtered slice, such as orders from one channel, as a share of all orders | Comparing many segments side by side |
Example
A table of daily web traffic has one row per day and channel, with these columns:
| Column | Kind | Example |
|---|---|---|
date | date | 2026-10-14 |
channel | dimension | Paid Search |
sessions | metric (sum) | 812 |
conversions | metric (sum) | 37 |
The board date picker is set to Oct 1 to Oct 30, 2026. In the tile editor:
| Setting | Value |
|---|---|
| Title | Conversions |
| Type | KPI |
| Data Table | Daily web traffic |
| Metric | conversions |
| Compare To | Previous Period |
| Size | Small |
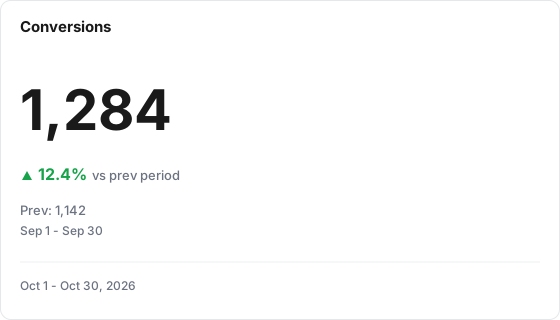
The tile shows:
| Part | Shows |
|---|---|
| Number | 1,284 (all conversions from Oct 1 to Oct 30) |
| Change | An up arrow and 12.4%, in green, labeled "vs prev period" |
| Prior value | Prev: 1,142, with the dates Sep 1 - Sep 30 |
The change is (1,284 - 1,142) / 1,142 = 12.4%. Previous Period is the 30 days just before the board's range.
Data it needs
- One metric. Any metric on the table works, including ratio and calculated metrics.
- A date on each row, so the tile can follow the date range. Every synced Lens table has one.
- For Show as % of total, a metric that adds up (sum or count). Rates have no share.
Settings
The tile editor has three tabs: Basics, Data and Display.
| Setting | What it does | Default |
|---|---|---|
| Title | The tile heading. Required, up to 80 characters | Empty |
| Description | Text shown behind an info icon on the tile, up to 500 characters | Empty |
| Size | Small (a quarter of the width), Third, Medium (half) or Large (full width) | Medium |
| Data Table | The table the metric comes from. Required | None |
| Metric | The number to show. Required | None |
| Filters | Rows the tile counts, such as channel = Paid Search. Several filters must all match. Applied to the current and comparison periods | None |
| Join with Table (optional) | Combines a second table on shared dimensions. See the limits below before using it | No join |
| Date range | Inherit from board, Ignore (all available data), Relative range, or Fixed dates | Inherit from board |
| Compare To | None, Previous Period, Same Day Last Week, Same Day Last Month, Same Day Last Year, or Same Week Last Year (-364d) | None |
| Show as % of total | Adds a line under the number: this tile's value as a share of the same metric without this tile's own filters | Off |
| Wording after the percentage | The words after the share, for example "of all sessions". Shown when Show as % of total is on | of total |
| Abbreviate large numbers | Shows 4.3M, 686K or 1.2B instead of the full number. Hover shows the exact value | Off |
| Thresholds (optional) | Under Health monitoring: Alert below, Warn below, Warn above, Alert above. Each box can stay empty | Empty |
Line tiles also offer stopped-moving alerts and automatic anomaly flags. A KPI tile does not, because it loads one total rather than day-by-day values.
How it calculates
- The number. One total for the whole date range. Sum and count metrics are added up. Ratio and calculated metrics are worked out once over the whole range (for example total conversions divided by total sessions), never as an average of daily rates.
- The date range. By default the tile follows the board's date picker. A tile with its own range shows a badge with that range on the board.
- Compare To. The tile fetches the comparison window with the same filters and works out (current - prior) / prior, shown to one decimal place with an up or down arrow.
| Compare To | Comparison window |
|---|---|
| Previous Period | The same number of days, ending the day before the range starts |
| Same Day Last Week | The full calendar week before the week the range ends in, using the property's week start day |
| Same Day Last Month | The full calendar month before the month the range ends in |
| Same Day Last Year | The same dates, one year earlier |
| Same Week Last Year (-364d) | The same dates moved back 364 days, so weekdays line up |
- Color. Green or red follows the metric's direction on the table (higher is better unless the metric says lower is better). A neutral metric stays grey.
- No comparison. If the prior total is zero or less, the tile shows "No comparison data" and the prior dates, not a percentage.
- % of total. The tile's value divided by the same metric with the date range and board filters, but without the tile's own filters, to one decimal place. It stays hidden for ratio and calculated metrics, and when the total is zero.
- Formatting. The metric's format on the table (currency, percent, decimals) is used. Abbreviation only applies to values of 1,000 or more and never to percentages.
- Health. Thresholds are checked against the number the tile shows. A value under Alert below or over Alert above turns the number red; the warn values turn it amber. A threshold left empty means no limit on that side.
What viewers can do
| Action | Board | Public report |
|---|---|---|
| Hover the number | Shows the exact value when abbreviated | Shows the exact value |
| Hover the prior value | Shows the comparison name, value and dates | Prior value and dates are printed under the number |
| Change the date range | Yes, unless the tile has its own range or the board hides date controls | Same |
| Pick a board comparison | Overrides Compare To on tiles that follow the board dates | Same |
| Use filter chips | Yes | Yes, unless hidden |
| Read the description | Info icon | Info icon |
| Summarize with AI | When AI features are on for the property | No |
On the public report, a KPI tile also draws a small trend line of the daily values under the number. The board does not.
Limits and gotchas
- Compare To is measured from the board's date range, not the tile's own range. A tile pinned to Last month with Previous Period compares against the period before the board's range. Use Inherit from board when you need a comparison, or use a Comparison tile.
- "Same Day Last Week" and "Same Day Last Month" compare whole calendar periods. With a 30-day range, Same Day Last Week compares 30 days against one week. Use Previous Period or Same Day Last Year for a like-for-like length.
- Previous Period matches length, not calendar. On "This month" up to Oct 29, the comparison is the 29 days before Oct 1, not all of September.
- Partial periods look like drops. A range that includes today compares a part day against full days.
- The public report does not show health colors on KPI tiles, and it does not show the date badge for a tile with its own range. Both appear on the board.
- Joins are board-only. The public report ignores Join with Table, and while a join is set the board ignores the tile's own filters and date range. For combined metrics, build a joined table instead. See Join Tables.
- Abbreviation keeps only a $ sign. Other currency symbols are dropped from an abbreviated value, and CA$ becomes $.
- A KPI tile cannot be broken down. For a number per channel, use a Table or Donut tile.