What it shows
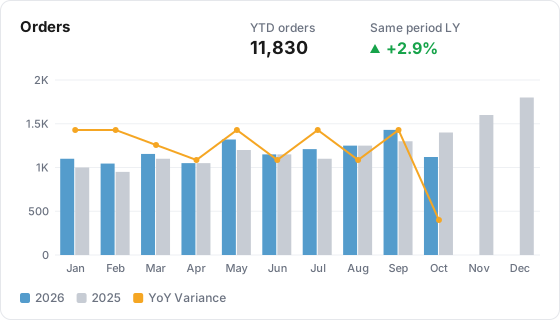
A Monthly YoY tile answers "are we ahead of last year?" for one metric. It draws paired monthly bars for the current year and the year before on a fixed January to December axis, a dashed variance line on a second % axis, and a year-to-date block in the top left with the change against the same months last year.
| Use it for | Not for |
|---|---|
| Annual tracking of a headline metric: orders, revenue, leads | Short ranges or day-level detail (use a Comparison tile) |
| Board reviews and monthly business reviews | A breakdown by channel (the series are the years, there is no Group By) |
| Seasonal businesses, where the same month last year is the fair benchmark | Fiscal years that do not start in January (the axis is always Jan to Dec) |
Example
Your table has a date column and an orders metric. Today is Oct 29, 2026.
| Setting | Value |
|---|---|
| Type | Monthly YoY |
| Data Table | shop_orders |
| Metric | orders |
| Date range | Inherit from board (default) |
With Date range on Inherit, the tile uses year to date (Jan 1 to Oct 29, 2026) and compares it with the whole of 2025. The legend reads 2026, 2025 and YoY Variance:
| Month | 2026 | 2025 | YoY Variance |
|---|---|---|---|
| Jan | 1,100 | 1,000 | +10.0% |
| Feb | 1,045 | 950 | +10.0% |
| Mar | 1,155 | 1,100 | +5.0% |
| Apr | 1,050 | 1,050 | 0.0% |
| May | 1,320 | 1,200 | +10.0% |
| Jun | 1,150 | 1,150 | 0.0% |
| Jul | 1,210 | 1,100 | +10.0% |
| Aug | 1,250 | 1,250 | 0.0% |
| Sep | 1,430 | 1,300 | +10.0% |
| Oct | 1,120 | 1,400 | -20.0% |
| Nov | no bar | 1,600 | none |
| Dec | no bar | 1,800 | none |
The year-to-date block reads "YTD orders" with 11,830, and under "Same period LY" the change +2.9% (11,830 against 11,500, the 2025 total for January to October). October reads -20.0% only because the month is not finished yet.
Data it needs
- One metric.
- A date on every row, at daily or finer grain.
- At least the previous calendar year of history for the grey bars, the variance line and the change.
Settings
| Setting | What it does | Default |
|---|---|---|
| Title | Name shown on the tile. Required, up to 80 characters | Empty |
| Description | Optional text behind an info icon on the tile, up to 500 characters | Empty |
| Size | Small, Third, Medium or Large. Medium or Large leaves room for twelve pairs of bars | Medium |
| Data Table | The Lens table the tile reads | None, required |
| Metric | The metric to chart | None, required |
| Filters | Limit the tile to matching rows. Applied to both years. Several filters must all match | None |
| Join with Table (optional), Join Key(s), Additional Metrics from Joined Table | Shown in the editor. Leave them empty for this tile type, see Limits below | No join |
| Date range | Inherit from board (default), Ignore (all available data), Relative range or Fixed dates | Inherit from board |
| Abbreviate large numbers | Shows 4.3M, 686K and so on in the year-to-date figure and on the bar axis | Off |
Group By, Bucket by and Compare overlay are not offered: the axis is always monthly and the comparison is always the previous year, set automatically when you save.
How it calculates
- Current period. With Date range on Inherit, the tile always uses year to date in the property's time zone, whatever the board's date picker says. With Ignore it also falls back to year to date. With a Relative or Fixed range, that range is used.
- Previous year. The full calendar year before the year the current period ends in, January 1 to December 31.
- Monthly bars. Each period's rows are grouped by calendar month. Ratio and expression metrics are calculated per month from their summed parts. A month with no rows draws no bar, so the current year stops at its last month with data instead of running to December at zero.
- Variance line. (this year - last year) / last year for each month, to one decimal place, labeled on each point. It is left out for a month where either year has no bar or last year is 0.
- Year-to-date total. The sum of the current year's monthly values, over the months that have data.
- Same period LY. The sum of last year's values for those same months only, never the whole prior year. The change is (YTD - same period LY) / same period LY, green when up and red when down. It shows a dash when last year has nothing for those months.
- Colors. The current year is red, last year is grey.
- No data. When the current period has no rows, the board shows only last year's bars and "--" as the year-to-date total. The public report shows "No data available".
What viewers can do
- Hover a month to see both years' values and the variance.
- Click a legend entry to hide or show a year or the variance line.
- Change the board's filter chips. The tile follows them.
- The board's date picker and its comparison picker never change this tile: it uses year to date, or its own Date range. A date badge on the tile shows the range it uses.
- The public report shows the same chart and year-to-date block.
Limits and gotchas
- The current month is partial. It is compared with the full month last year, so it usually reads as a drop until the month ends. The year-to-date change includes it too.
- The year-to-date total adds up the months. That is right for counts and sums. For a rate such as conversion rate it adds the monthly rates together, which is not a meaningful figure. For a count-distinct metric such as users, each month counts its own users, so someone active in three months counts three times. Use this tile with summable metrics.
- The change color ignores metric direction. Up is always green and down is always red, even for a metric where lower is better, such as cost per lead.
- Pick ranges inside one calendar year. The axis has one slot per month, regardless of year. A range that crosses January 1, such as Trailing 12 months, lands both years' months in the same series.
- Fiscal years are not supported. The axis always runs January to December.
- Do not add a join. On the board, a joined Monthly YoY tile loses its previous-year bars, variance line and year-to-date change. The public report ignores the join.