Tile types
Each type has its own page with a worked example, every setting and how the numbers are calculated.
| Type | Shows |
|---|---|
| KPI | One number, with an optional change against an earlier period |
| Line | A metric over time, one line per group. Tick Stacked for a stacked area chart |
| Bar | A metric over time or by group, side by side or stacked |
| Donut | Each group's share of the total |
| Table | Rows by group, with several metrics, sorting, totals and paging |
| Cross-tab | Rows by one dimension, columns by another (top 8, the rest as Other), one metric |
| Comparison | One metric now against an earlier period, with the change and a day-by-day chart of both |
| Monthly YoY | Monthly bars this year against last year on a January to December axis, with a variance line and a year-to-date total |
| Intraday | Today by hour against the same day last week and last year |
| US Map | A metric by US state, from a dimension holding state codes or names |
| Overlap | How many users fall into several cohorts at once |
| Attribution | Credit for conversions across channels, from user-level touch data |
| Funnel | How many users reach each step |
| Time to Conv. | How long users take from first touch to conversion |
| Retention | How many users come back in later periods |
| Journey | The common paths users take to a conversion |
| Flow | How users move between values of a dimension |
| Content | Your own text and links, for notes and section headings |
Overlap, Attribution, Funnel, Time to Conv., Retention and Journey need a table with a user key (for example a client or user ID) and can use cohorts.
Sizes
| Size | Width |
|---|---|
| small | A quarter of the board |
| third | A third |
| medium | Half (default) |
| large | Full width |
Options by tile type
| Option | Tile types |
|---|---|
| Data table and metric | All except Content |
| Additional metrics (drag to reorder) | Line, Bar, Table, when no Group By or comparison is set |
| Group By | Line, Bar, Donut, Table, Cross-tab, Flow |
| Columns dimension (top 8 + Other) | Cross-tab |
| Tile filters | KPI, Table, Line, Bar, Donut, Comparison, Intraday, Monthly YoY, Retention, Flow |
| State dimension | US Map |
| Stack bars by | Intraday |
| Join a second table on key dimensions | Standard tile types |
| Bucket by: auto, day, week, month | Line, Bar |
| Compare overlay | Line, Bar |
| Compare To | KPI, Table, Line, Bar, Donut, Comparison (required on Comparison) |
| Stacked | Line, Bar |
| Total line, with an optional label | Line, Bar with a Group By |
| Show total row | Table, Time to Conv., Attribution |
| % of total | Table |
| Show as % of the unfiltered total | KPI |
| Abbreviate large numbers | KPI, Comparison, Table |
| Sort by and direction, Paginate | Table |
| Rows to show (default 10, up to 500) | Table |
| Health monitoring (thresholds, zero or flat streaks, anomaly alerts) | KPI, Line, Bar |
| Content and collapse state | Content |
| Date range | All |
Date range
| Setting | Effect |
|---|---|
| Inherit (default) | Follows the board's date picker |
| Ignore | All dates in the table |
| Relative | today, yesterday, this week, last week, last 7, 30 or 90 days, this month, last month, latest month, this quarter, last quarter, year to date, this year, last year, trailing 12 or 24 months |
| Fixed | Your own start and end dates |
A tile's relative range includes today. The board picker's "Last N days" ends yesterday unless Include today is on. See Dates and Time Zones.
Comparisons
| Setting | Tile types | Options |
|---|---|---|
| Compare To | KPI, Table, Line, Bar, Donut, Comparison | Previous period, last week, last month, last year, same week last year |
| Compare overlay | Line, Bar | Previous period, previous year, previous 1 to 10 years |
| Board compare (viewer) | Tiles that follow the board dates | Previous period, same dates last year, same weekdays last year, custom range |
The board compare is a viewer choice and is not saved with the board.
Filter operators
Tile filters and board filters accept these operators. Several tile filters must all match.
| Operator | Matches |
|---|---|
= | Exactly equal. On a list column, the list contains the value |
!= | Not equal |
contains, not_contains | The value appears inside the text. Case-sensitive |
in, not_in | One of a comma-separated list |
>, >=, <, <= | Numeric comparison |
is_empty, is_not_empty | Empty text, or an empty list |
Any other operator, such as begins_with or a regular expression, shows an error on the tile rather than returning nothing. For "starts with", use contains with a value long enough to be unambiguous.
Pivot conditions and grouping rules use their own set (exact, contains, begins with, ends with, regular expression and their negatives), which is not case-sensitive. See Pivot Tables and Groupings.
Board-level controls
| Control | Detail |
|---|---|
| Date picker | Today, yesterday, last 7, 14, 28, 30, 90 or 365 days with Include today; this or last week, month, quarter or year; month, quarter and year to date; saved property ranges; a custom range |
| Default date range | Set in board settings; empty means the last 30 days |
| Default trend grain | Day, week, month or auto |
| Filter chips | One per dimension in the board's tables. Values in one chip are OR; separate chips are AND |
| Hide date controls, hide filter controls | Fix the view for viewers |
| Hide healthy tiles | Collapse tiles whose health checks pass |
View links
Add these to a board or report URL to open it on a given view. A link's range wins over the board default.
| Parameter | Example |
|---|---|
range | ?range=30d, ?range=last_month, ?range=7d&today=0 |
from, to | ?from=2026-10-01&to=2026-10-28 |
compare | &compare=previous_period, or &compare=custom&cfrom=2025-10-01&cto=2025-10-28 |
tv, dwell (reports only) | ?tv=1&dwell=10 rotates tabs every 10 minutes |
Pages in this section
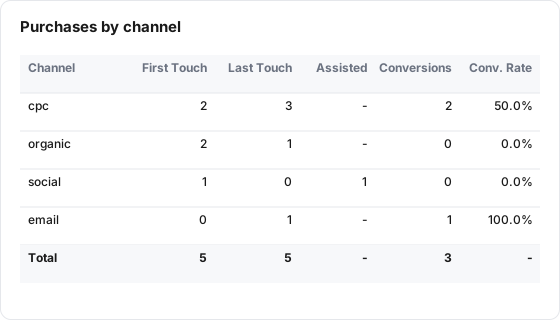 AttributionA table of first-touch, last-touch and assisting users per channel, with conversions credited to each user's last channel. Use it to see which channels open and which close.
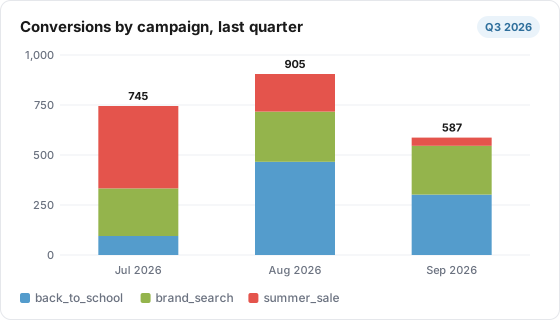 BarA bar tile shows a metric over time as columns, side by side or stacked by group, with an optional total line and comparisons. Use it for period totals and how groups make them up.
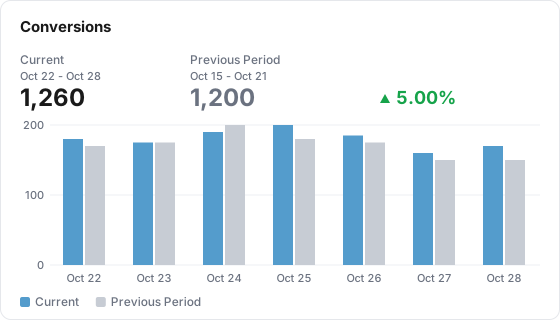 ComparisonA Comparison tile puts one metric's current total next to an earlier period's total, with the change, and a day-by-day chart of both periods and their variance.
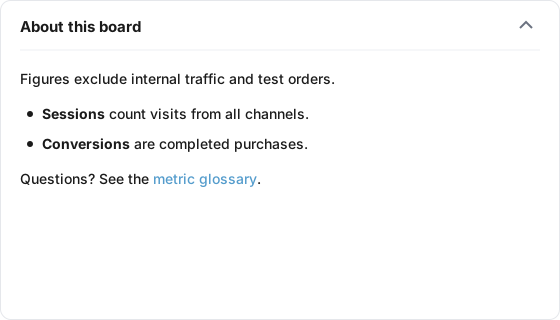 ContentA content tile holds your own text, links and simple formatting instead of data. Use it for section headings, notes on how to read a board, and caveats about the numbers.
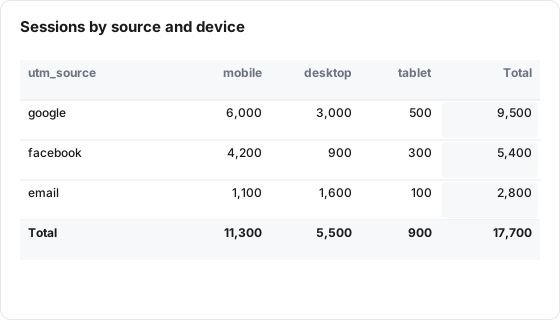 Cross-tabA Cross-tab tile is a grid of one metric: rows by one dimension, columns by another, with row, column and grand totals.
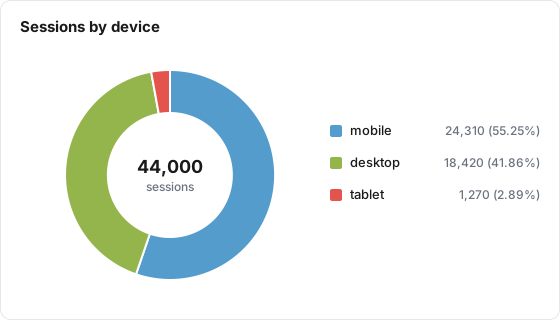 DonutA donut tile shows how a metric splits across the values of one dimension, as slices of a ring, with an optional second ring for an earlier period. Use it for a simple mix with a few values.
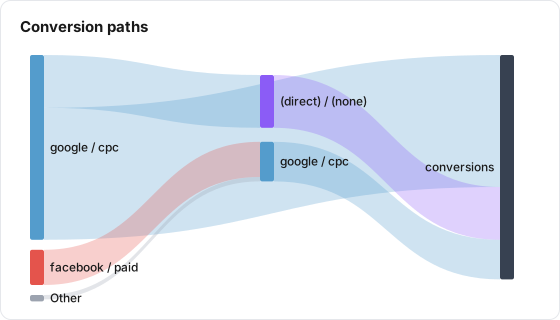 FlowA Sankey diagram of journeys stored as path values, such as google / cpc > email / newsletter, sized by a metric. Use it to show how conversions flow through step 1, step 2 and onward.
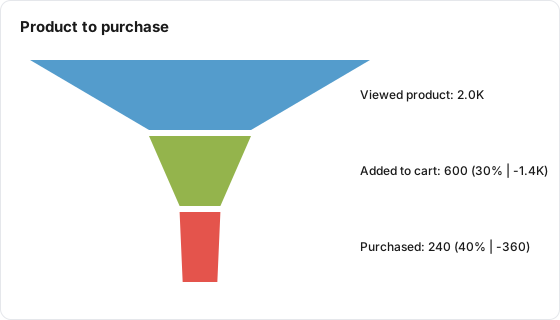 FunnelA funnel chart of how many users match each step, where every step only counts users who also matched all the steps before it. Use it to find where people drop out.
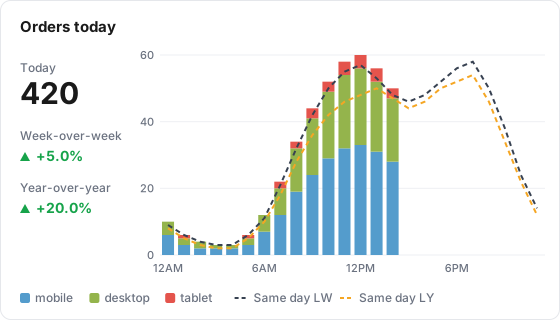 IntradayAn Intraday tile shows today's metric hour by hour against the same weekday last week and last year, with week-over-week and year-over-year changes so far today.
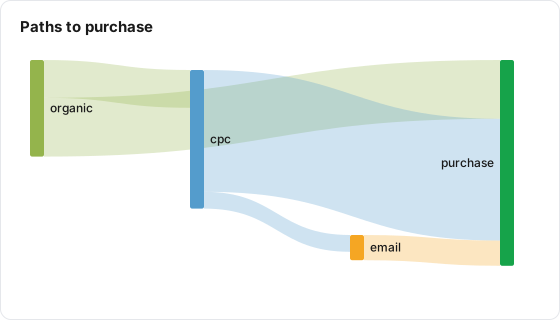 JourneyA Sankey diagram of the channels converting users moved through, built straight from user-level event rows. Use it to see the common channel sequences that end in a conversion.
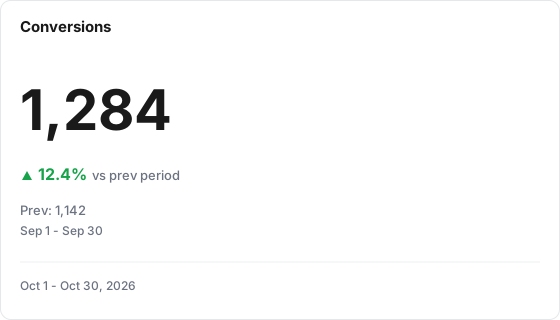 KPIA KPI tile shows one metric as a single big number for the date range, with an optional change against an earlier period. Use it for the headline figures a reader should see first.
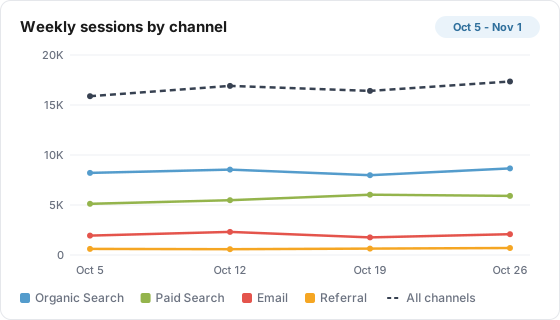 LineA line tile plots a metric over time, as one line or one line per group, with optional stacking, a total line and comparisons. Use it to see trends and spot changes.
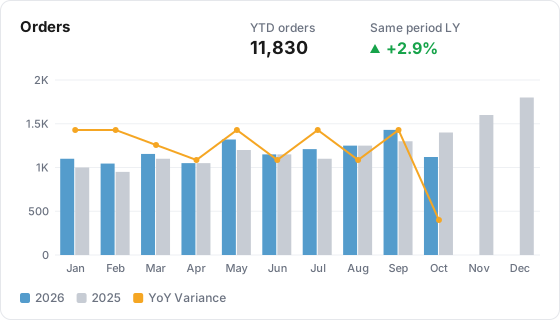 Monthly YoYA Monthly YoY tile shows one metric month by month for this year against last year on a January to December axis, with a variance line and a year-to-date total.
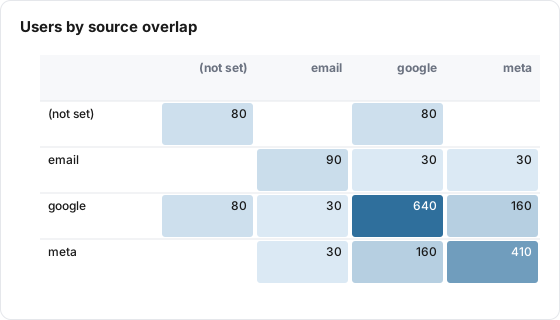 OverlapA heatmap of how many users appear under two values of the same dimension, such as two traffic sources. Use it to see which channels share an audience.
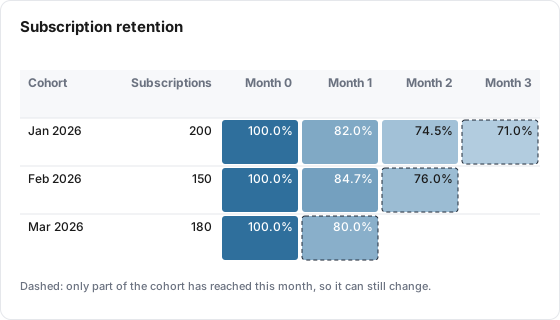 RetentionA cohort matrix of how many members are still active in each period after they started, from subscription start and end dates or from repeat activity. Use it to track churn and repeat behavior.
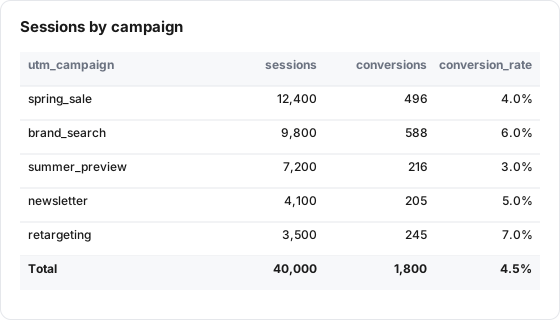 TableA Table tile lists one row per value of a dimension, with one or more metric columns, an optional comparison column, a share of total, a Total row and paging.
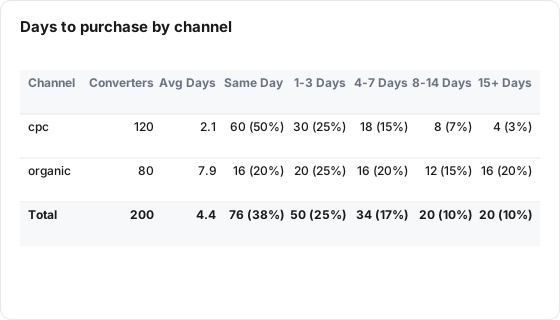 Time to ConversionA table of how many days users take from their first row to their first conversion, by the channel they first arrived through. Use it to see which channels convert quickly.
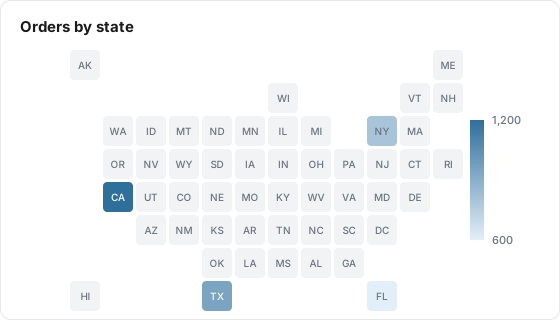 US MapA US Map tile shades each US state by one metric, from a dimension that holds state codes or names, so you can see where your results come from.