What it shows
A Table tile breaks a metric down by one dimension, one row per value, such as sessions by campaign. Add more metrics and each one becomes a column. With a single metric you can add a comparison column and a change %, and a share-of-total column with a small bar.
| Use it for | Not for |
|---|---|
| Ranked lists: top campaigns, pages, sources, products | One headline number (use a KPI tile) |
| Several metrics side by side for the same rows | Two dimensions at once (use a Cross-tab tile) |
| A daily or monthly table when Group By is a date | A trend you want to read at a glance (use a Line tile) |
Example
Your table has a date column, a utm_campaign dimension, the metrics sessions and conversions, and a ratio metric conversion_rate (conversions divided by sessions).
| Setting | Value |
|---|---|
| Type | Table |
| Data Table | web_sessions |
| Metric | sessions |
| Additional Metrics | conversions, conversion_rate |
| Group By | utm_campaign |
| Sort by | Auto (recommended) |
| Rows to show | 5 |
| Show Total Row | On |
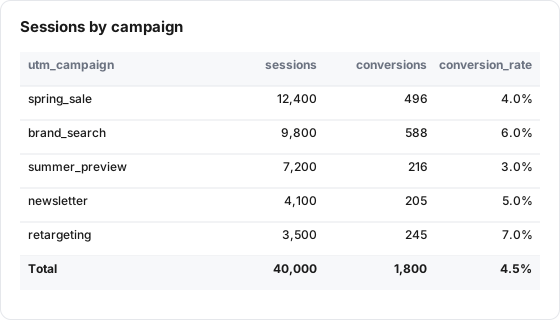
The board's date range holds seven campaigns. The tile sorts them by sessions, highest first, keeps the top 5 and adds a Total row:
| utm_campaign | sessions | conversions | conversion_rate |
|---|---|---|---|
| spring_sale | 12,400 | 496 | 4.0% |
| brand_search | 9,800 | 588 | 6.0% |
| summer_preview | 7,200 | 216 | 3.0% |
| newsletter | 4,100 | 205 | 5.0% |
| retargeting | 3,500 | 245 | 7.0% |
| Total | 40,000 | 1,800 | 4.5% |
The Total row counts all seven campaigns, including the two that are not shown (2,000 and 1,000 sessions), so it is larger than the sum of the visible rows. The total conversion rate is 1,800 / 40,000, not an average of the rates in the column.
Data it needs
- One metric at least. More metrics come from the same table.
- A dimension for Group By. Without one the table has a single row, which a KPI tile shows better.
- For Compare To, nothing extra: the tile runs the same query over the earlier dates.
- Group By can be a dimension, a derived dimension or a custom grouping.
Settings
| Setting | What it does | Default |
|---|---|---|
| Title | Name shown on the tile. Required, up to 80 characters | Empty |
| Description | Optional text behind an info icon on the tile, up to 500 characters | Empty |
| Size | Small (a quarter of the width), Third, Medium (half) or Large (full width) | Medium |
| Data Table | The Lens table the tile reads | None, required |
| Metric | The first metric column. It also drives the Auto sort and % of total | None, required |
| Additional Metrics | More metric columns, in the order shown. Drag a chip to reorder | None |
| Group By | The dimension that makes the rows | None (total only) |
| Filters | Limit the tile to matching rows. Several filters must all match. Operators: equals, not equals, contains, not contains, in (comma-sep), not in (comma-sep), is empty, is not empty, >, >=, <, <= | None |
| Join with Table (optional) | Joins a second table to this tile. Board only, see Limits below | No join |
| Join Key(s) | Dimensions present in both tables to join on | None |
| Additional Metrics from Joined Table | Metrics of the joined table to include | None |
| Date range | Inherit from board (default), Ignore (all available data), Relative range or Fixed dates | Inherit from board |
| Relative range | Shown for a relative range: today, yesterday, this week, last week, last 7, 30 or 90 days, this month, last month, latest month with data, this quarter, last quarter, year to date, this year, last year, trailing 12 or 24 months | Last 30 days |
| Fixed start date, Fixed end date | Shown for fixed dates | Empty |
| Compare To | None, Previous Period, Same Day Last Week, Same Day Last Month, Same Day Last Year, Same Week Last Year (-364d). Adds a comparison column and a change % column | None |
| Show Total Row | Adds a Total row at the bottom | On |
| Show % of total | Adds a "% of Total" column with a bar: each row's share of the first metric's total | Off |
| Abbreviate large numbers | Shows 4.3M, 686K and so on. Hover a cell for the exact number | Off |
| Sort by | Auto (recommended), the Group By dimension, or any of the tile's metrics | Auto |
| Direction | Shown once you pick a Sort by: Descending or Ascending | Ascending for a dimension, Descending for a metric |
| Show all rows in pages | Keeps every row and pages through them instead of cutting to the top rows | Off |
| Rows to show | How many rows to keep, from 1 to 500. Reads Rows per page when paging is on | 10 |
How it calculates
- Rows. The tile groups the table by the Group By dimension over the date range, then works out each metric per row. Ratio and expression metrics are calculated per row from their parts (conversions over sessions for that row), never as an average of daily rates. See Calculated Metrics.
- Sort, Auto. When Group By is a date or period, rows run oldest to newest. Otherwise they run by the first metric, highest first. Ties sort by the dimension value.
- Sort, chosen. Dates and numbers sort by value. Text sorts naturally, so "step 2" comes before "step 10".
- Row limit. After sorting, the tile keeps the first Rows to show rows. One exception: a date dimension sorted oldest first keeps the most recent rows and still shows them oldest first.
- Total row. Calculated from every row the query returned, not only the rows shown. Ratios are recalculated from the summed parts.
- % of total. Each row's first-metric value divided by the total of the same metric over the tile's dates and filters, calculated across all rows, not just the rows on screen. The column is left out for ratio and expression metrics, because a rate is not part of a whole.
- Compare To. The tile runs the same query over the comparison dates and matches rows by dimension value. The comparison column shows the earlier value and the change % is (current - earlier) / earlier, to one decimal place, with an up or down arrow. It is green or red depending on whether the metric is set as higher-is-better or lower-is-better, and grey for a neutral metric. When the earlier value is 0 or blank the change shows a dash. The Total row gets its own comparison and change.
- Comparison windows. Previous Period is the same number of days just before the current range. Same Day Last Week is the full calendar week before the week the range ends in, using the property's week start. Same Day Last Month is the full calendar month before the month the range ends in. Same Day Last Year is the same dates one year earlier. Same Week Last Year shifts the dates back 364 days so weekdays line up.
- Blank values. A row whose dimension value is empty is labeled "(unknown)".
- No data. The board shows the column headers and a Total row of zero. The public report shows "No data available".
What viewers can do
- Hover an abbreviated number to see the exact value.
- On the board, hover the comparison column header to see the exact comparison dates.
- Page through rows with the pager under the table when paging is on. It reads "Showing 1-10 of N", and the Total row stays visible on every page.
- Change the board's dates and filter chips. Tiles set to Inherit follow them.
- Pick a comparison at the top of the board or report (Previous period, Same dates last year, Same weekdays last year, Custom range). On a single-metric table that follows the board dates, this adds or replaces the comparison columns for that view only.
- The public report shows the same table. Column headers cannot be clicked to re-sort on either surface.
Limits and gotchas
- Several metrics turn off Compare To. With Additional Metrics, the table shows one column per metric and skips the comparison columns, on the board and in the report.
- % of total uses the first metric only, and is not available for rate metrics.
- Unique counts in the Total row are added up. For a count-distinct metric such as users, the Total row sums the rows, so a person who appears under two campaigns is counted twice.
- Compare To is measured from the board's dates. If you give the tile its own Date range, the current column follows the tile but the comparison window is still worked out from the board's range (except Same Week Last Year on a tile pinned to this week or last week). Keep Date range on Inherit when you use Compare To.
- Same Day Last Week and Same Day Last Month compare whole calendar periods. On a 30-day board, Same Day Last Week compares 30 days against 7. Use Previous Period for a like-for-like window.
- Paging has a ceiling. A tile fetches at most 5,000 rows, taken by the first metric, highest first. A dimension with more values than that is cut before paging.
- Rows to show stops at 500.
- Joins are applied on the board only. The public report ignores the join and shows the main table alone. A joined tile on the board also uses the board's dates and filters only: its own Date range and Filters are not applied. To combine tables reliably, build a Join table and point the tile at it.
- Filters in the editor are all AND. A tile saved with OR groups through the API keeps them, and the editor says so, but cannot show them as rows.