What it shows
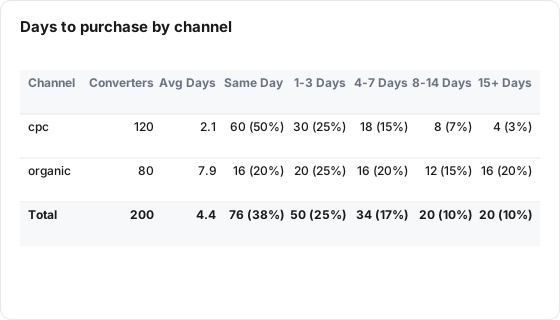
The Time to Conversion tile (Time to Conv. in the editor) is a table with one row per first-touch channel. For every user who converted, it measures the calendar days between their first row and their first conversion, then reports the average and how many converters fell into each time bucket.
| Use it for | Not for |
|---|---|
| Seeing which channels bring people who buy the same day and which need weeks | Hours or minutes to convert (it counts whole days) |
| Choosing a sensible lookback window for other reports | Users who never converted (only converters are counted) |
| Checking whether a campaign shortens the time to buy, with a cohort | Crediting the conversion to a channel (use Attribution) |
Example
An events table has client_id (the user key), utm_medium and event_name.
| Setting | Value |
|---|---|
| Type | Time to Conv. |
| User Key | client_id |
| Channel Dimension | utm_medium |
| Conversion Event Dimension | event_name |
| Conversion Event Value | purchase |
| Show Total Row | On |
The tile shows (percentages are of each row's converters):
| Channel | Converters | Avg Days | Same Day | 1-3 Days | 4-7 Days | 8-14 Days | 15+ Days |
|---|---|---|---|---|---|---|---|
| cpc | 120 | 2.1 | 60 (50%) | 30 (25%) | 18 (15%) | 8 (7%) | 4 (3%) |
| organic | 80 | 7.9 | 16 (20%) | 20 (25%) | 16 (20%) | 12 (15%) | 16 (20%) |
| Total | 200 | - | 76 (38%) | 50 (25%) | 34 (17%) | 20 (10%) | 20 (10%) |
Avg Days is colored: green at 1 day or less, orange from over 1 to 7 days, red above 7. Here cpc is orange and organic is red.
Data it needs
- A user key that identifies a person across rows.
- A channel dimension, filled on the row a user first arrives with.
- A conversion event dimension and the value that marks a conversion.
- Several rows per user, so there is a first row before the conversion. A user whose only row is the conversion counts as Same Day.
Settings
| Setting | What it does | Default |
|---|---|---|
| Title | The tile header. Required | Empty |
| Description | Optional text behind an info icon | Empty |
| Type | Time to Conv. | KPI |
| Size | Small, Third, Medium or Large | Medium |
| Data Table | The table to read | None |
| User Key | The dimension that identifies a user. Required | None |
| Channel Dimension | The dimension that holds the channel. Required | None |
| Conversion Event Dimension | The dimension that holds the event name. Required | None |
| Conversion Event Value | The exact value that counts as a conversion. Required | Empty |
| Cohort (optional) | Limits the tile to users in one cohort built on the same table | All users (no cohort) |
| Date range | Shown in the editor, but this tile always follows the board's date range | Inherit from board |
| Show Total Row | Adds a Total row on the board | On |
The buckets are fixed. There is no setting for them.
How it calculates
- Lens reads rows in the board's date range (only cohort users, when a cohort is set).
- For each user it finds their first row: its date, and the channel on it. Empty channels become (not set).
- It finds the date of each user's first conversion: the earliest row where the conversion dimension exactly equals the conversion value.
- Users with no conversion in the range are left out.
- Days to convert = the number of calendar days from the first row's date to the conversion's date. The same date is 0.
- Converters are grouped by first-touch channel:
| Column | Counts |
|---|---|
| Converters | Converting users whose first row had this channel |
| Avg Days | The average days to convert, to one decimal |
| Same Day | 0 days |
| 1-3 Days | 1 to 3 days |
| 4-7 Days | 4 to 7 days |
| 8-14 Days | 8 to 14 days |
| 15+ Days | 15 days or more |
Rows are sorted by Converters, largest first. On the board, each bucket also shows its share of the row's converters, rounded to a whole percent. The Total row adds up the counts and shows - for Avg Days.
If nobody converted in the range, the board shows "No conversion data found" and the public report shows "No data available".
What viewers can do
| Action | Board | Public report |
|---|---|---|
| Read the table | Counts with percentages, plus the Total row when Show Total Row is on | Counts only, no percentages and no Total row. Bucket headers read 1-3d, 4-7d, 8-14d and 15+d |
| Info icon | Shows the tile description | Same |
| "How to read this" icon | Opens a short guide to the table | Not shown |
| AI button | Summarizes the table, when AI features are on for the property | Not shown |
| Change the date range | The tile reloads | Same |
The table cannot be sorted or exported.
Limits and gotchas
- The clock starts at the first row in the range. A user who first visited before the range starts is measured from their first row inside it, which makes them look faster. Use a range that starts well before the conversions you care about.
- Days are calendar dates, not 24-hour periods. A visit at 11 PM and a purchase at 1 AM the next day count as 1 day.
- Dates are the table's stored dates. For sources stored in UTC, such as Echo, the day boundary is midnight UTC, not midnight in your property's time zone. See Dates and Time Zones.
- Only the first conversion counts. Repeat purchases do not add rows or change the days.
- The channel is the first row's channel, not the channel of the converting visit.
- Board filter chips do not apply, and the tile's own Date range setting is ignored: the tile always uses the board's range. Use a cohort to narrow the users.
- Rows with an empty user key count as one user. Use a user key that is always filled.
- The public report shows a simpler table: no percentages and no Total row.