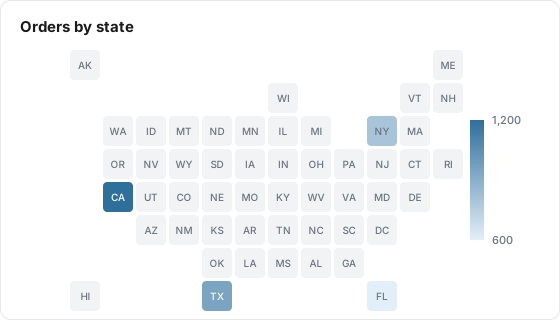
A US Map tile shades each US state by one metric, from a dimension that holds state codes or names, so you can see where your results come from.
Illustration with the numbers from the Example below
What it shows
A US Map tile colors each state by a metric, from light blue for low values to dark blue for high ones, with a High to Low scale on the right. States with no data stay grey. Alaska and Hawaii are drawn as small insets in the bottom left.
Use it for
Not for
Where orders, leads or sessions come from, by state
Countries, provinces or cities (only US states are drawn)
Spotting regional gaps for geo-targeted campaigns
Exact rankings (add a Table tile grouped by state next to it)
A quick visual on an executive board
Rates that need many rows per state combined (see Limits)
Example
Your table has a region dimension and an orders metric. The region values are mixed: CA, TX, US-NY, Florida, (not set) and ON.
Setting
Value
Type
US Map
Data Table
shop_orders
Metric
orders
State Dimension
region
region value
orders
On the map
CA
1,200
California, darkest blue
TX
950
Texas
US-NY
800
New York
Florida
600
Florida, lightest blue of the four
(not set)
300
Left out
ON
40
Left out, not a US state
The scale runs from 0 to 1,200. Every other state stays grey, and hovering one of them shows 0.
Data it needs
One metric.
A dimension holding US states. The editor asks for 2-letter codes, and the tile also accepts these forms, in any letter case:
Form
Example
2-letter code
CA
Code with a US prefix
US-CA
Full state name
California
The 50 states and the District of Columbia are drawn. Territories such as Puerto Rico are not, and "Washington DC" written that way is not recognized: use DC or District of Columbia.
Settings
Setting
What it does
Default
Title
Name shown on the tile. Required, up to 80 characters
Empty
Description
Optional text behind an info icon on the tile, up to 500 characters
Empty
Size
Small, Third, Medium or Large. Medium or Large keeps the map readable
Medium
Data Table
The Lens table the tile reads
None, required
Metric
The metric that colors the states
None, required
State Dimension
The dimension that holds the state. Required
None
Date range
Inherit from board (default), Ignore (all available data), Relative range or Fixed dates
Inherit from board
How it calculates
Per state. The tile groups the table by the state dimension over the date range, then turns each value into a state. Values that point to the same state, such as CA and California, are added together.
Dropped values. Anything that is not one of the 50 states or DC is left out without a warning: blanks, "(not set)", other countries' region codes.
Color scale. From 0 to the highest state value. States with data are shaded along the scale. States with no data stay grey, so "no data" never looks like "low".
No data. On the board the map draws with every state grey. The public report shows "No data available".
What viewers can do
Hover a state to see its name and value.
Drag the handles on the High to Low scale to highlight only the states in a value range.
Change the board's dates and filter chips. Tiles set to Inherit follow them.
The map does not zoom, pan or drill down, and the board's comparison picker has no effect on it.
The public report shows the same map.
Limits and gotchas
Rates and unique counts can be off when one state has several values. If the dimension holds both CA and California, the two rows are simply added. That is right for counts and sums, but a conversion rate becomes the sum of two rates and a count of users can count a person twice. Clean the state values in the source data before mapping a rate.
Hovering a grey state shows 0. It means no data, not a measured zero.
No tile filters, Compare To or abbreviation. The editor does not offer them for this tile type. Use board filter chips to narrow it.
Outside the US is dropped silently. A table with mostly international traffic can look almost empty. Check the share of rows with a US state before reading too much into it.
City and country dimensions do not work. Point the tile at the state or region dimension.